
Find the Right Market Report
Search thousands of industry reports, market insights, and research studies in one place.
Search thousands of industry reports, market insights, and research studies in one place.
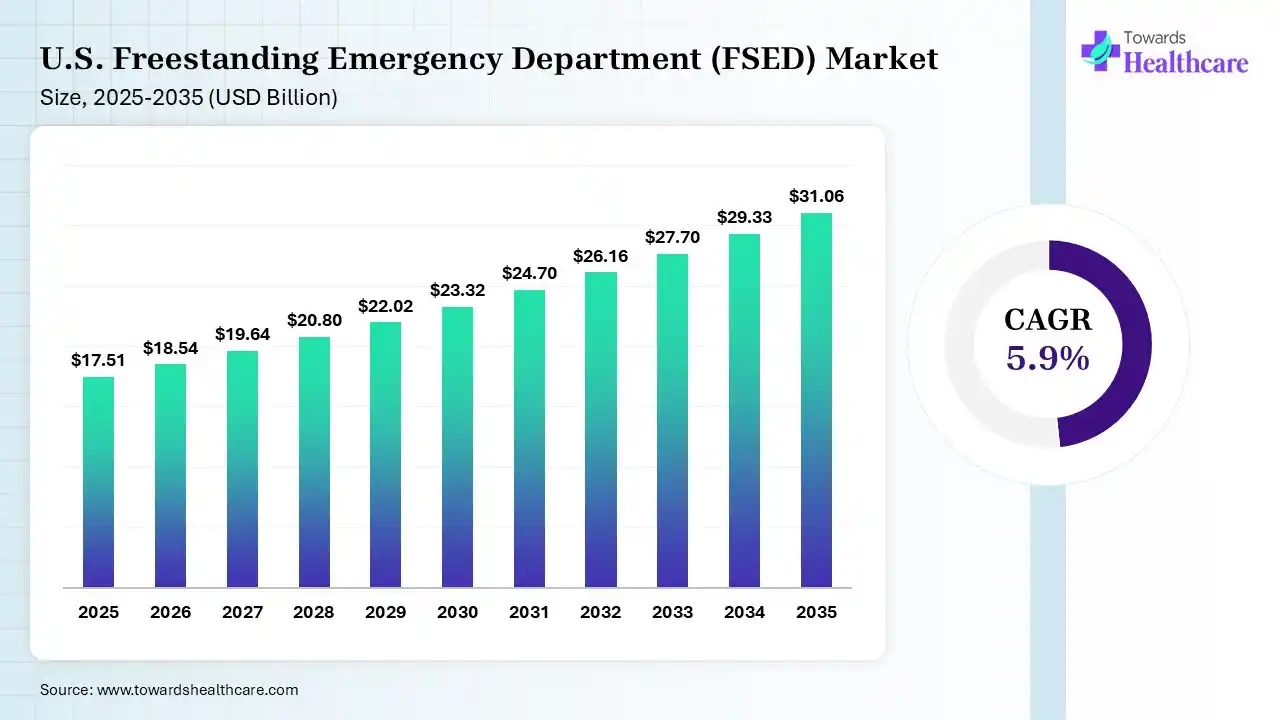
According to Payal Rabde, who specializes in research related to FSED services, faculty models, and healthcare services, with 5+ years of experience in market research and industry analysis, extensive research indicates strong growth opportunities in the U.S. freestanding emergency department (FSED) market. U.S. freestanding emergency department (FSED) market size was estimated at USD 17.51 billion in 2025 and is predicted to increase from USD 18.54 billion in 2026 to approximately USD 31.06 billion by 2035, expanding at a CAGR of 5.9% from 2026 to 2035. Her analysis highlights that the U.S. freestanding emergency department (FSED) market is rapidly expanding due to increasing emergency care demand, rising infant visits, growing mergers, and expanding independent facilities, along with key industry players like HCA Healthcare, Inc., Envision Healthcare, Adeptus Health, American Physician Partners, and TeamHealth.
A freestanding emergency department (FSED) refers to the licensed facility structurally separate from an inpatient hospital campus that offers 24/7 physician-led emergency medical evaluation and treatment. Based on the American College of Emergency Physicians (ACEP) regulations, both hospital-affiliated “off-campus emergency departments” (OCEDs) and “independent freestanding emergency departments” (IFSEDs) operating outside any hospital license under state-specific regulatory frameworks are included in the same category. These departments help in providing emergency diagnostic care, trauma management, hospital transfer services, along with other emergency medical care.
Furthermore, this report helps in covering the full scope of the market, highlighting U.S. healthcare infrastructure, emergency care demand, pricing and reimbursement support, procedure and patient volume, site development, cost structure and capital economics, value chain analysis, technological advancements, competitive landscape, and M&A/investments. Additionally, cost-of-care briefs and the private equity stakeholder projects deal-tracking database are also included in the report, which are published by CDC/NCHS, the American Hospital Association, the UNC Sheps Center for Health Services Research, ACEP, and UnitedHealth Group.
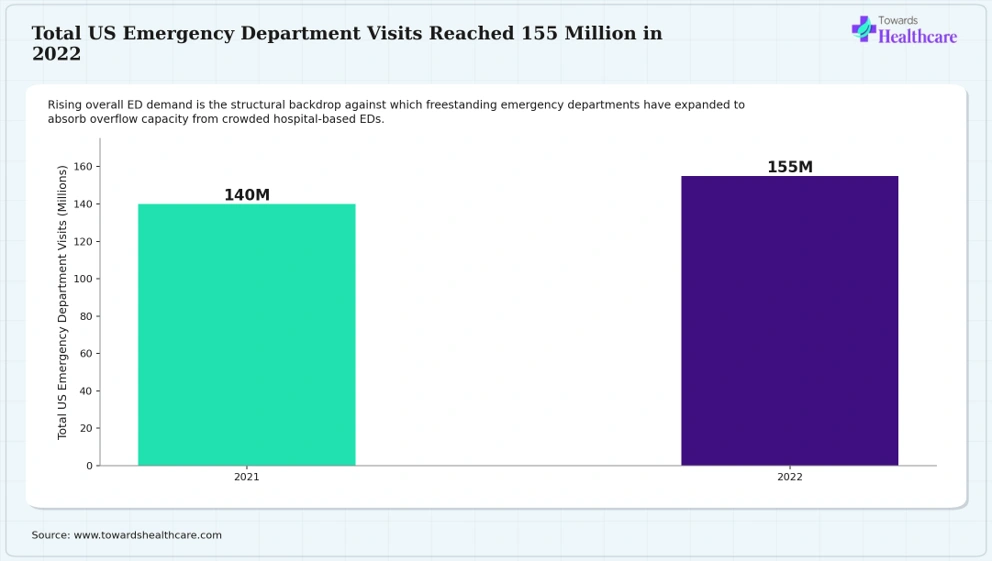
Graph 1: As the market research analyst, I interpret that the given bar chart compares total U.S. emergency department visits in 2021 and 2022. In 2021, the total number of U.S. ED visits was recorded to be 140 million, which increased to 155 million in 2022 due to growing emergency care demand, shorter waiting periods, and insurance coverage.
Key Insight:
The significant growth in just one year reflects the rapid growth in emergency care demand that traditional hospital ED capacity can absorb and is one of the major factors in FSED expansion nationwide.
Source: CDC/NCHS, “Emergency Department Visit Rates by Selected Characteristics: United States, 2022,” NCHS Data Brief No. 503, Aug. 2024
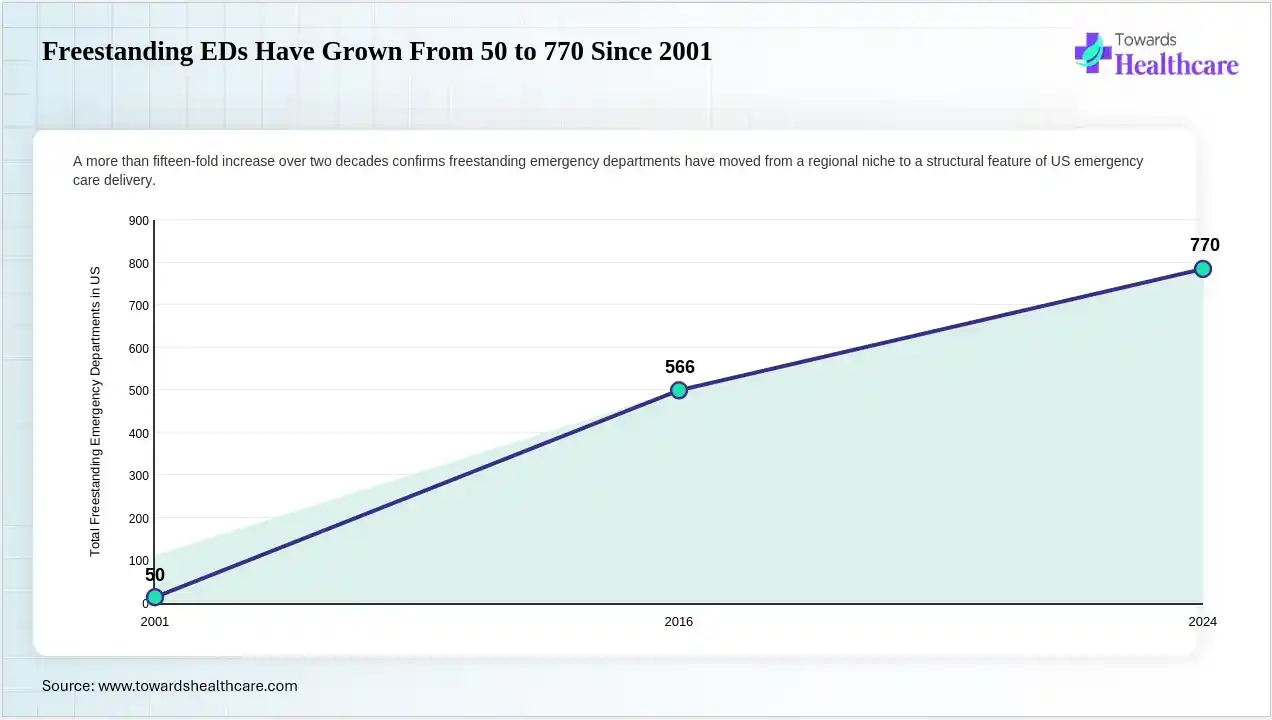
Graph 2: The above-mentioned line chart illustrates the total U.S. freestanding ED count from 2001 to 2024, which shows gradual growth. In 2021, the total U.S. freestanding ED count was reported to be 50 with 1% of all EDs, which increased to 566, making it 11% of all EDs in 2016. It recorded a further rise to approximately 770, which is 13.4% of all EDs in 2024, confirming a shift of freestanding emergency departments from a regional niche to a structural feature of U.S. emergency care delivery.
Key Insight:
Remarkably consistent growth in FSED count was recorded over 23 years, which confirmed the expansion of these facilities as a durable structural shift and not a short-term trend.
Source: Western Journal of Emergency Medicine (citing NEDI-USA and MedPAC 2016 data); Ivy Clinicians, “State of the U.S. Emergency Medicine Employer Market,” March 2024
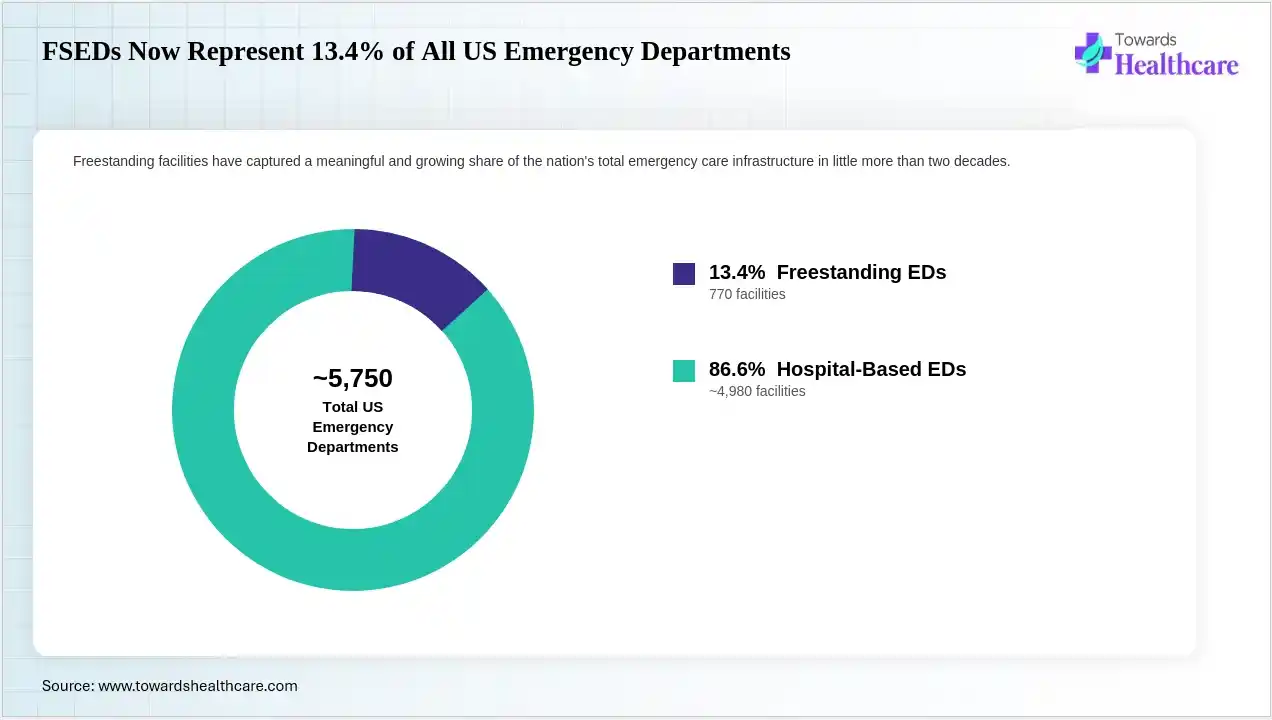
Graph 3: Based on the information gathered, the donut chart compares freestanding and hospital-based ED share in 2024. Hospital-based EDs held the major share of 86.6%, contributing approximately 4,980 facilities of all U.S. EDs in 2024, while freestanding EDs held a significant share of 13.4% of all U.S. EDs, accounting for 770 facilities, indicating their rapid expansion.
Key Insight:
The significant growth of freestanding EDs represents their conversion from a niche delivery model into a mainstream component of the national emergency care infrastructure.
Source: Ivy Clinicians, “State of the U.S. Emergency Medicine Employer Market,” March 2024
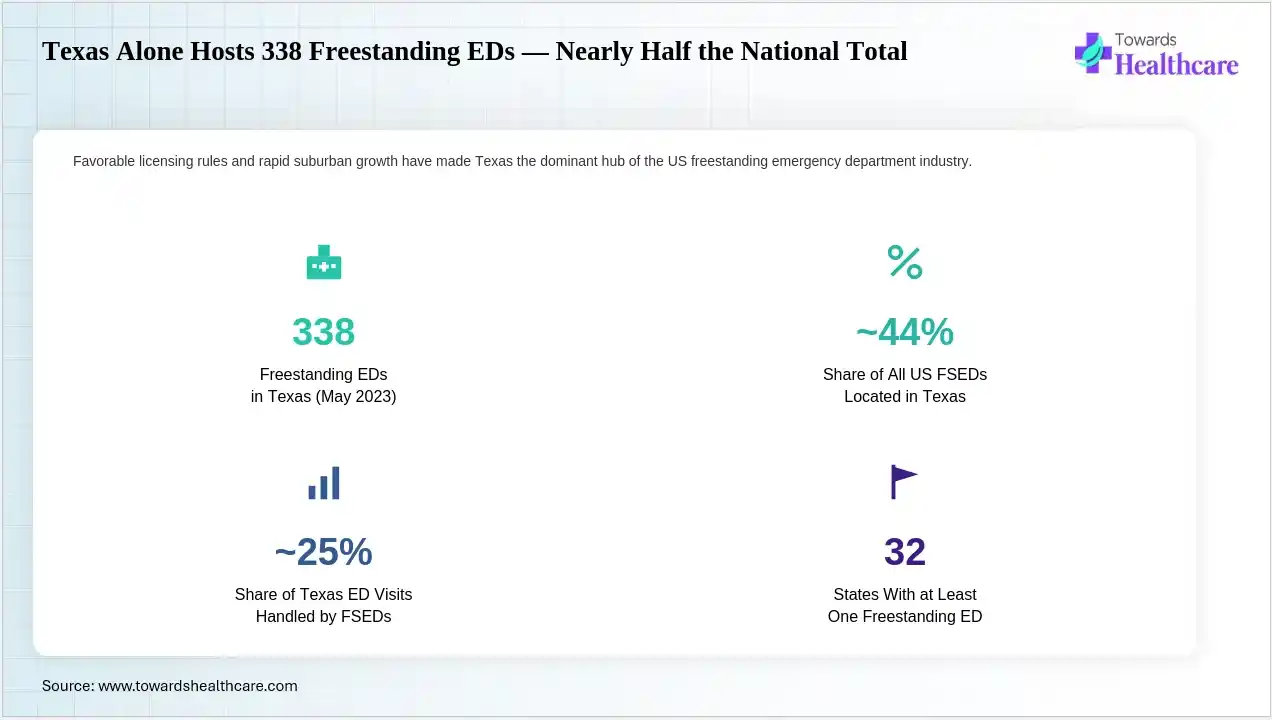
Graph 4: As per my analysis, the given infographic stat panel represents Texas FSED concentration metrics. Freestanding EDs in Texas as of May 2023 were reported to be 338, while the states with at least one freestanding ED were noted to be 32. The share of all U.S. FSEDs located in Texas was recorded to be approximately 44, while the share of ED visits handled by FSEDs accounted for roughly 25%. This indicates that favorable licensing rules and rapid suburban growth in Texas are responsible for its dominance in the market.
Key Insight:
Roughly 44% of the entire national FSED footprint contributes to Texas due to its state-specific licensing environments and the growing underlying demand economics.
Source: Texas A&M University School of Public Health, “Freestanding Emergency Departments Are Popular, But Do They Function As Intended?” April 2024
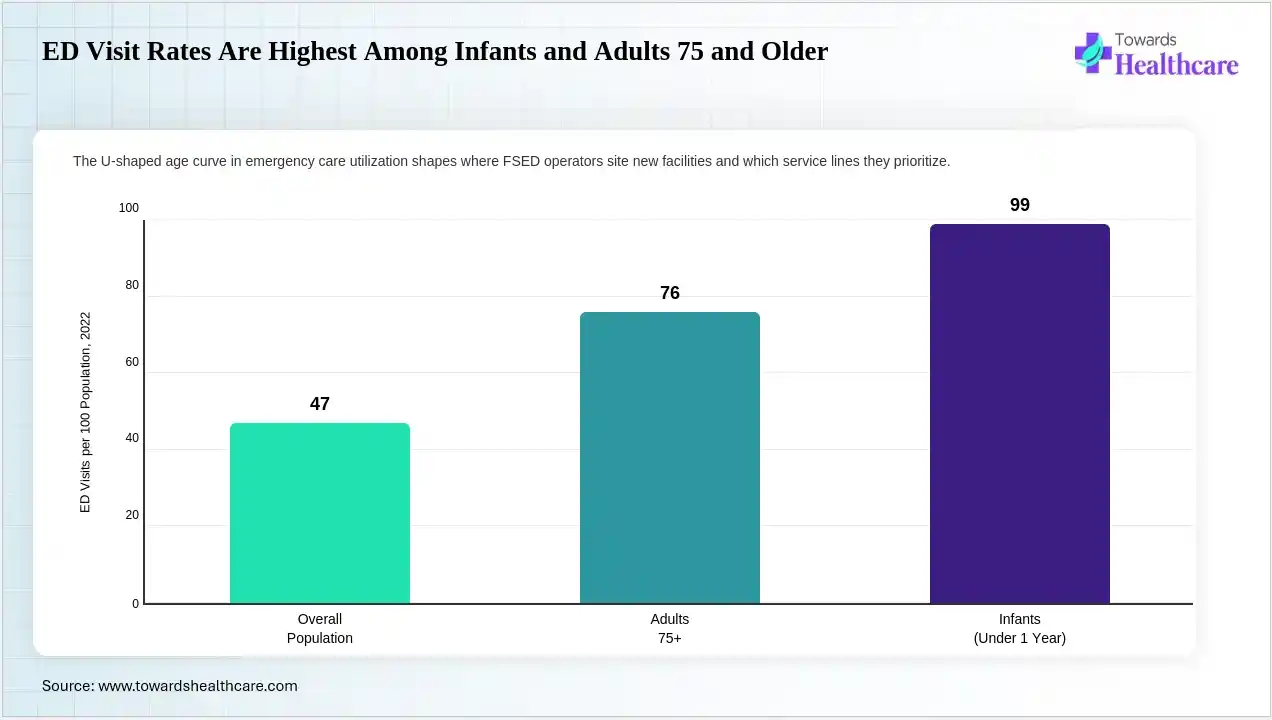
Graph 5: The bar chart highlights ED visit rates by age group in 2022, which reflect significant growth due to expanding facilities and services. The overall population ED visits per 100 population in 2022 were reported to be 47, out of which adults above 75 years of age contributed to 76 visits per 100 population, while infants under 1 year accounted for 99 visits per 100 population.
Key Insight:
The growth in the infants visit was noted to be more than double the overall population rate, while adults demonstrated 1.6x the overall growth rate.
Source: CDC/NCHS, “Emergency Department Visit Rates by Selected Characteristics: United States, 2022,” NCHS Data Brief No. 503, Aug. 2024
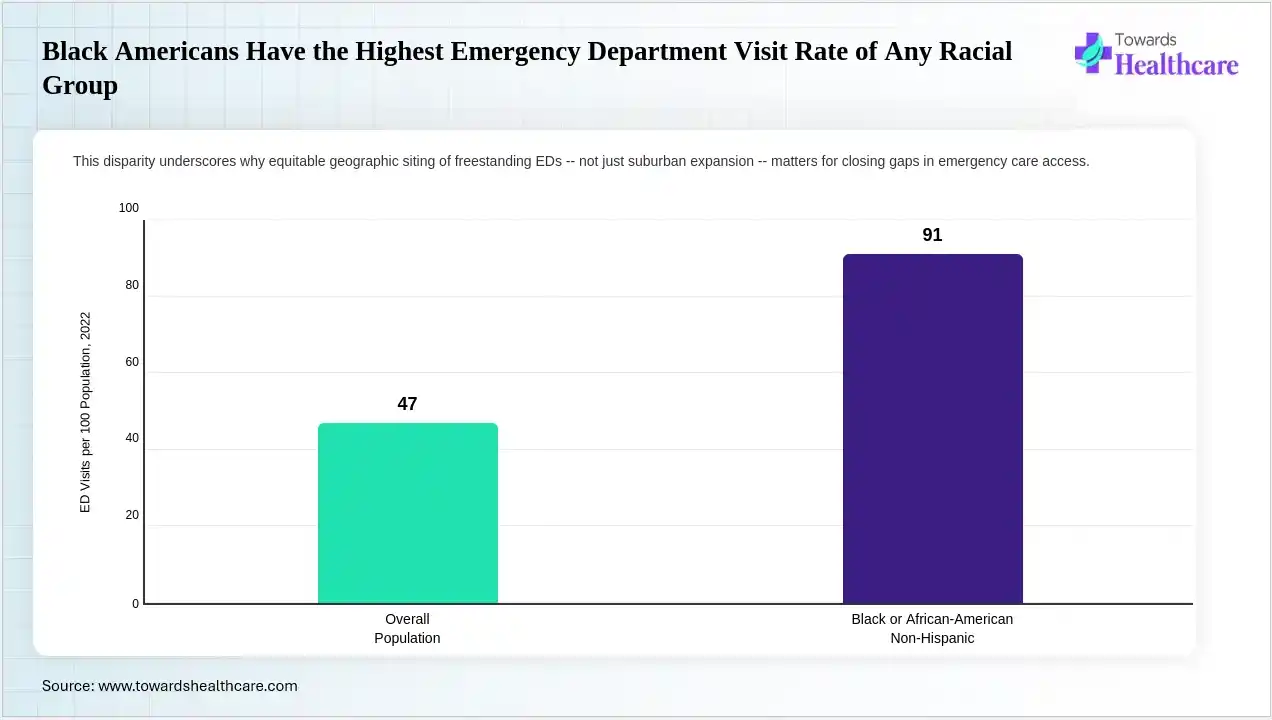
Graph 6: Based on our research, the bar chart indicates ED visit rates by comparing the overall population with the Black non-Hispanic population in 2022. The overall population contributed to 47 ED visits per 100 population in 2022, which increased to 91 in the Black or African-American, non-Hispanic population, highlighting growing demand for emergency care services.
Key Insight:
The rising ED utilization among Black Americans at double the overall population rate drives the FSED expansion to offer persistent access and address the preventive-care gap.
Source: CDC/NCHS, “Emergency Department Visit Rates by Selected Characteristics: United States, 2022,” NCHS Data Brief No. 503, Aug. 2024
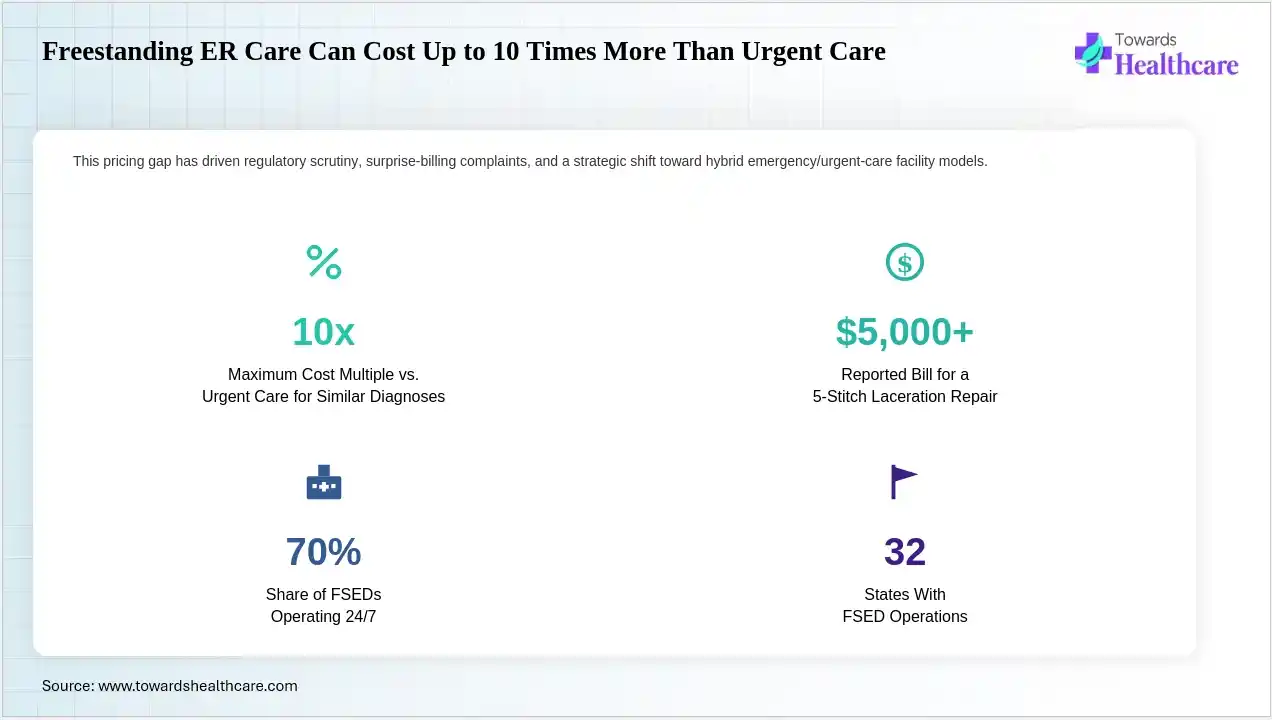
Graph 7: As the market research analyst, I interpret that the given infographic stat panel represents FSED cost and operating-model metrics. Maximum cost multiple vs. urgent care for similar diagnoses demonstrated a growth of 10x, while the reported bill for a 5-stitch laceration repair contributed to more than $5,000. The share of FSEDs operating 24/7 held an approximate 70% share, while states with FSED operations were reported to be 32. This is driving the use of hybrid emergency/urgent-care facility models to overcome the pricing gap.
Key Insight:
ER patients paying up to 10x more than urgent-care patients, as per the Annals of Emergency Medicine study, makes them the major driver for the use of hybrid emergency/urgent-care facility models, along with the growing regulatory scrutiny and surprise-billing complaints.
Source: Healthcare Dive, “Adeptus Health acquired by NYC hedge fund,” Oct. 2017 (citing Annals of Emergency Medicine study)
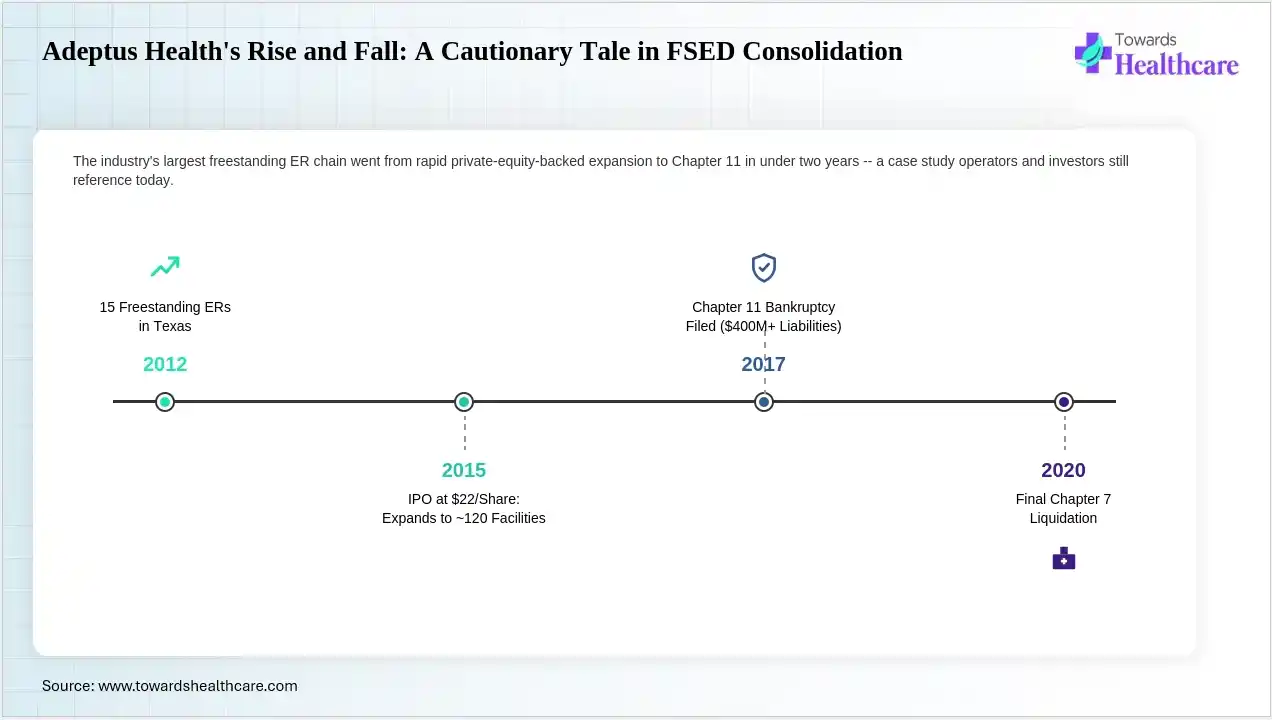
Graph 8: The timeline infographic illustrates Adeptus Health corporate milestones from 2012 to 2020. In 2012, Adeptus Health recorded 15 freestanding ERs operating in Texas, and in 2015 it announced an IPO at $22/share and expansion to approximately 120 facilities across 4 states plus 5 hospitals, marking its major expansion. 2017, it filed for Chapter 11 bankruptcy with approximately $400 million in liabilities, and in 2020 it filed Chapter 7 liquidation after a brief post-bankruptcy restructuring.
Key Insight:
The court filing of Adeptus Health shows it went from rapid private-equity-backed expansion to Chapter 11 in just two years, during which it also extracted $641 million from a $57 million initial investment before its liquidity crisis forced bankruptcy
Source: Wikipedia (Adeptus Health, corporate record); Bloomberg Law, 2019; Texas Lawbook, 2021
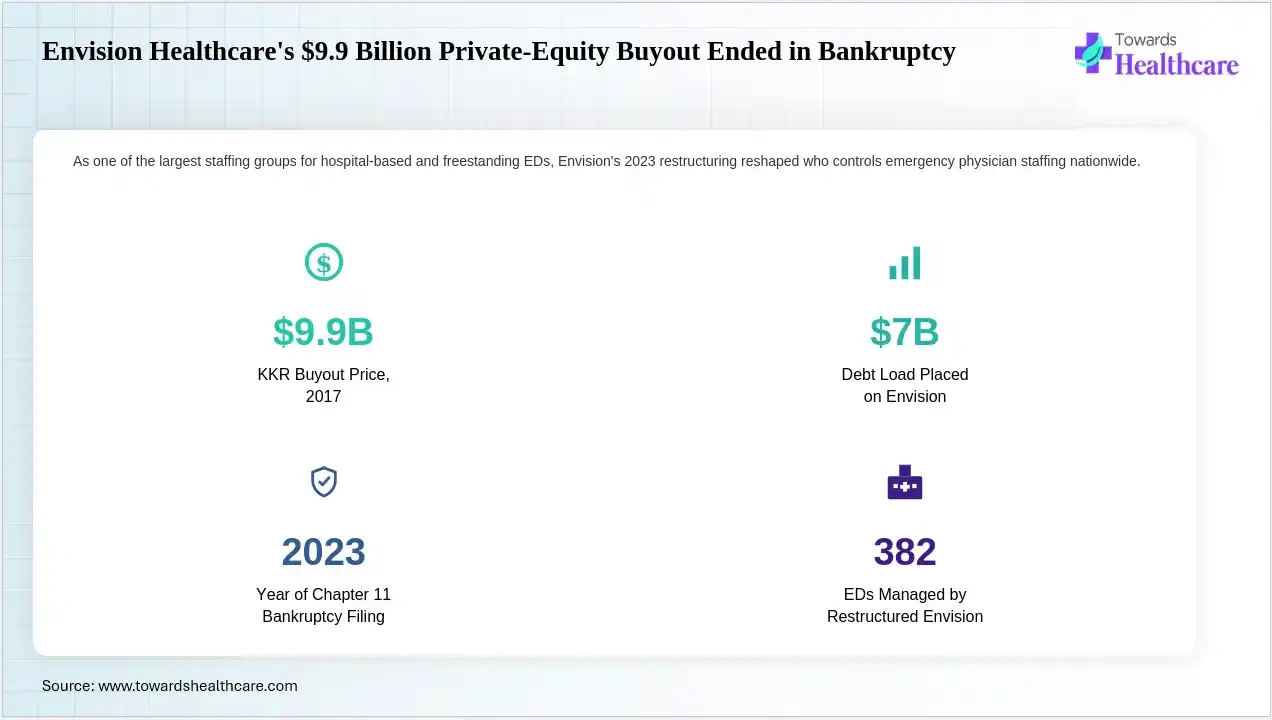
Graph 9: The above-mentioned infographic stat panel covers Envision Healthcare buyout and restructuring metrics. In 2017, the KKR buyout price was noted to be $9.9 billion, where the debt load placed on Envision was valued at $7-7.7 billion. 2023 was reported as the year of the Chapter 11 bankruptcy filing, while EDs managed by restructured Envision accounted for 382, which helped reshape emergency physician staffing control nationwide.
Key Insight:
Envisions post-bankruptcy lender group is now controlling one of the countrys largest emergency medicine staffing platforms, reflecting how financial engineering is becoming consequential to the FSED market as facility-level M&A.
Source: Ivy Clinicians, March 2024; PMC, “Private Equity and the Ravaging of United States Health Care,” 2025
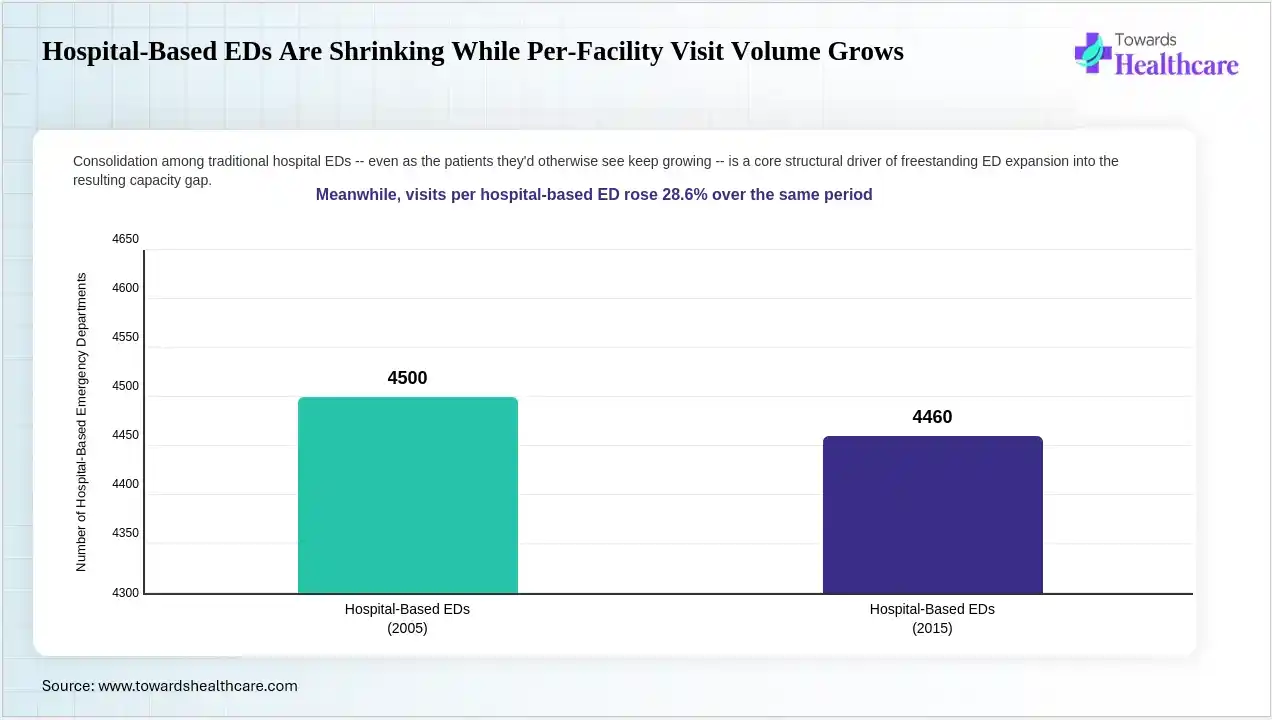
Graph 10: Based on our research, the bar chart compares hospital-based ED count in 2005 and 2015. 2005, registered a total of 4,500 hospital-based EDs, which declined to 4,460 hospital-based EDs with 200 closures, 138 mergers, and 160 new openings in 2015. Therefore, the rising hospital-based ED depiste their closures due to growing emergency care demand, act as the core structural driver of freestanding ED expansion.
Key Insight:
Even though hospital-based EDs experienced a modest net decline, the number of visits per surviving hospital-based ED rose by 28.6% over the same decade, enhancing their expansion.
Source: Annals of Emergency Medicine, cited in ScienceDirect (AHA Annual Survey analysis, 2005–2015)
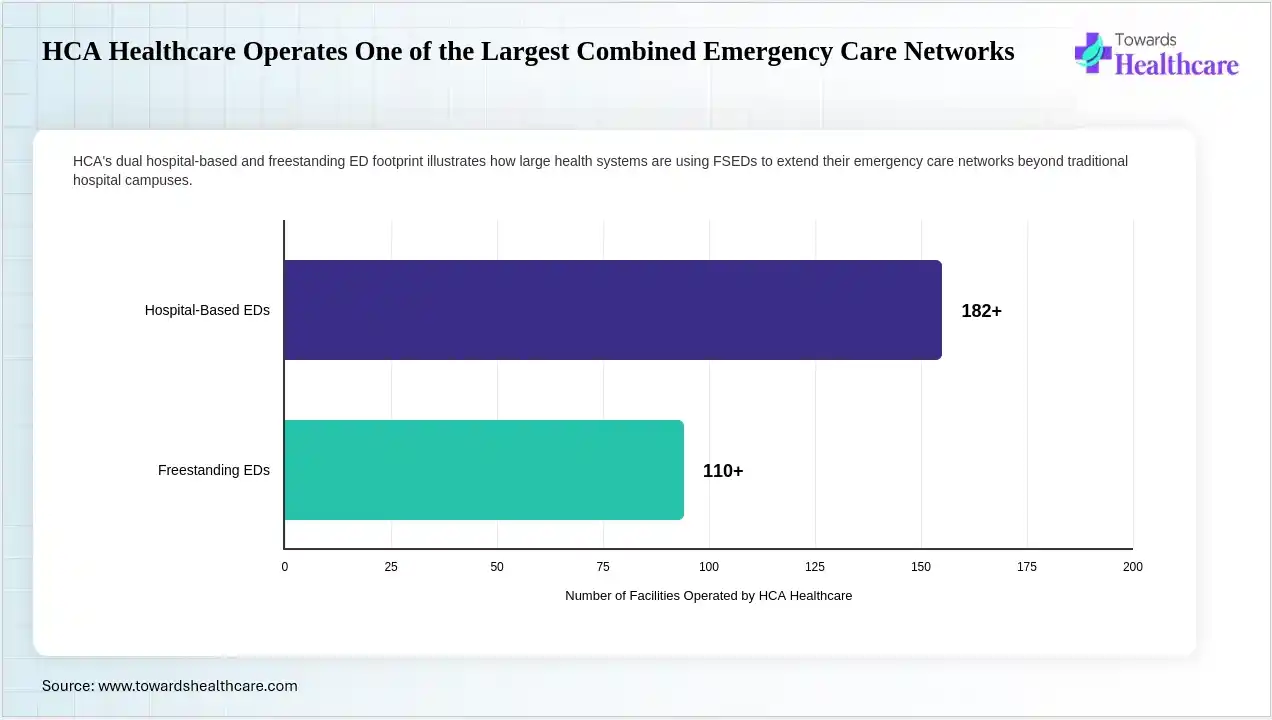
Graph 11: The above-mentioned horizontal bar chart illustrates HCA healthcare hospital-based and freestanding ED counts. It indicates that the hospital-based EDs accounted for 182 HCA healthcare count, while the freestanding EDs contributed to more than 110 HCA healthcare count, highlighting the growing use of FSEDs to extend emergency care networks.
Key Insight:
The growing HCA healthcare hospital-based and freestanding ED count nationwide reflects that large health systems are using FSEDs as a deliberate network-extension strategy.
Source: Ivy Clinicians / Emergency Medicine Workforce Newsletter, March 2024
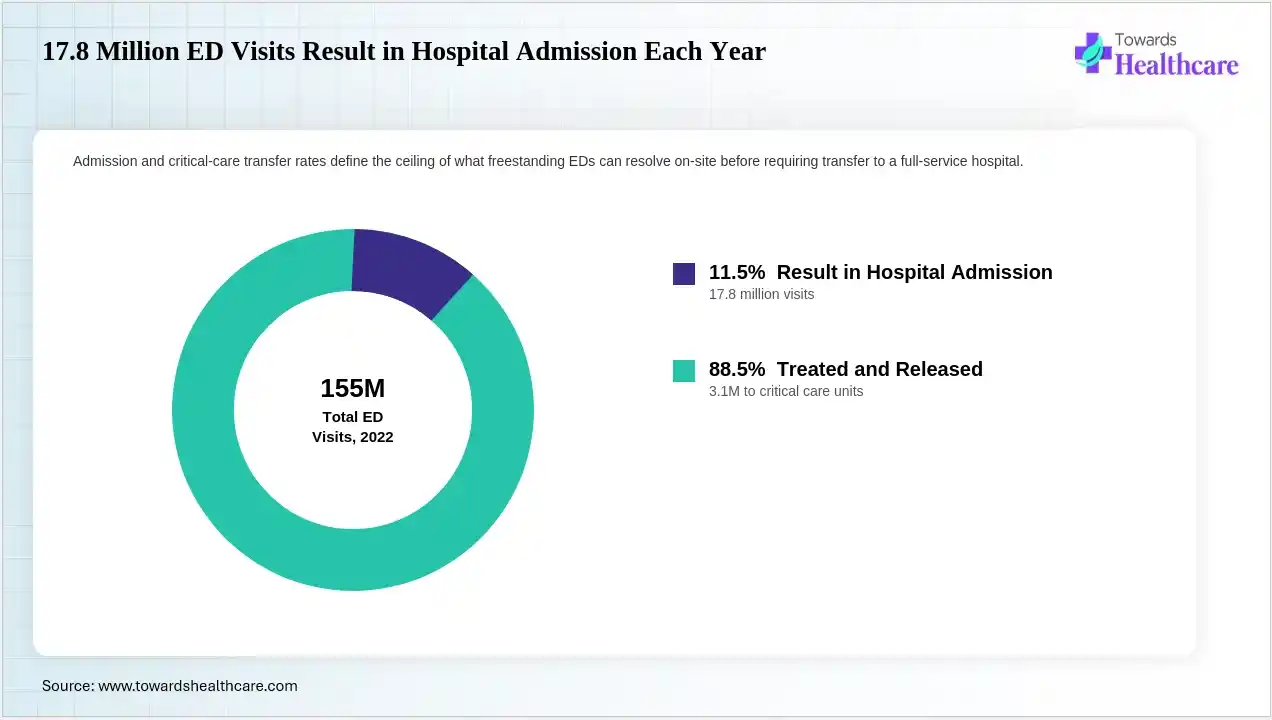
Graph 12: According to the survey conducted, the donut chart illustrates ED visit outcomes in 2022, which accounted for 155M. The share of total 2022 ED visits that resulted in hospital admission was reported to be 17.8 million visits, accounting for 11.5%, whereas the visits resulting in critical care unit admission were noted to be 3.1 million visits, contributing to 2.0%. Furthermore, the share of total 2022 ED visits that were treated and released held an 88.5% share.
Key Insight:
With nearly 9 in 10 ED visits resolved without hospital admission, help in highlighting what freestanding EDs can resolve on-site before requiring transfer to a full-service hospital.
Source: CDC/NCHS, FastStats: Emergency Department Visits, citing 2022 NHAMCS data
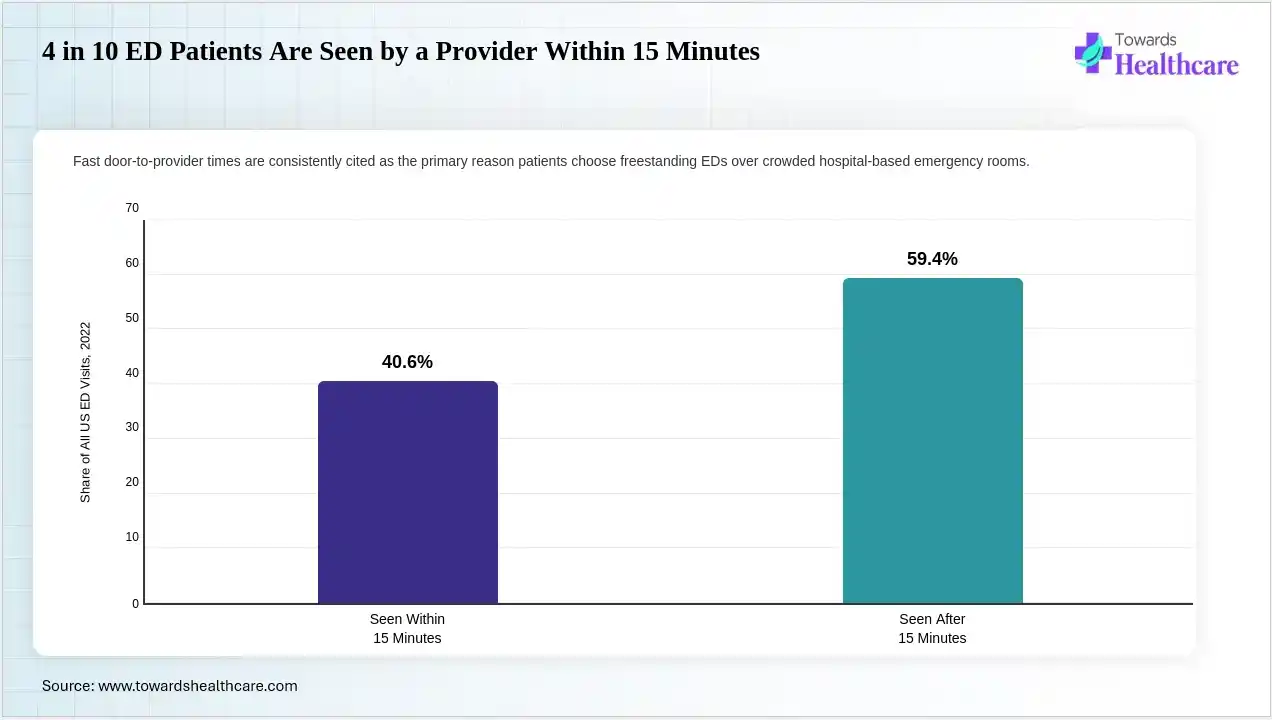
Graph 13: The bar chart reflects the share of ED visits by door-to-provider wait time in 2022, indicating a rise in the seen after 15 minutes wait time category. The share of all U.S. ED visits with a waiting time of 15 minutes held 40.6%, while 59.4% of providers were seen after 15 minutes, which encouraged the freestanding EDs to focus on minimizing their waiting time.
Key Insight:
With fewer than half of all ED visits seeing a provider within 15 minutes, freestanding EDs should focus on improving their ability to meet the providers within the set period of time.
Source: CDC/NCHS, FastStats: Emergency Department Visits, citing 2022 NHAMCS data
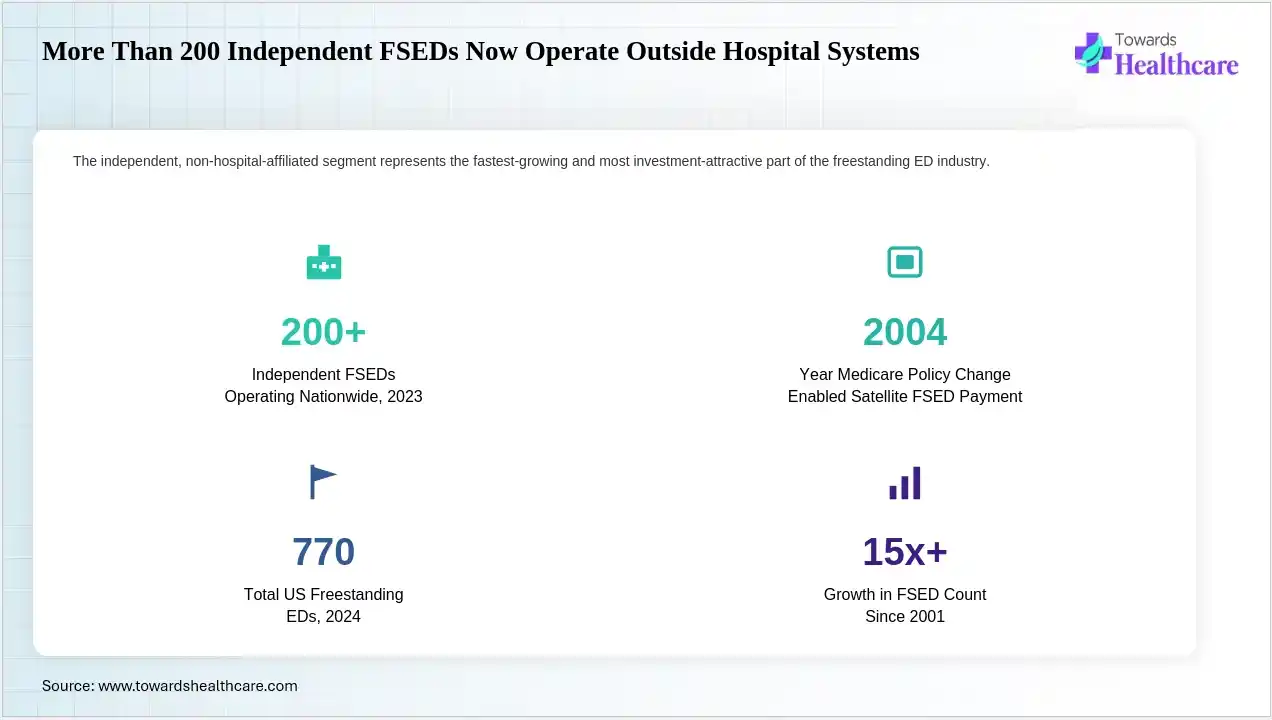
Graph 14: As the market research analyst, I interpret that the given infographic stat panel covers independent FSED segment scale metrics. The independent FSEDs operating nationwide in 2023 were valued at more than 200, while the year the Medicare policy change enabled satellite FSED payment was recorded as 2004. Total U.S. freestanding EDs in 2024 were reported to be 770, where the growth in FSED count since 2001 was noted to show more than a 15x growth rate.
Key Insight:
The introduction of the 2004 Medicare policy change stopped the extension of independent facilities, indicating that the independent FSEDs are relying on commercial insurance and self-pay revenue, making them an investment-attractive part of the industry.
The market is sized using verifiable structural indicators, rather than a dollar-denominated FSED market-size or CAGR figure, as they are syndicated model outputs without a disclosed, reproducible methodology.
| Indicator | Value | Source |
| Total U.S. emergency department visits (2022) | 155 million | CDC/NCHS NHAMCS |
| Total U.S. freestanding EDs (2024) | ~770 facilities | Ivy Clinicians |
| FSED share of all U.S. EDs (2024) | 13.4% | Ivy Clinicians |
| Independent (non-hospital-affiliated) FSEDs (2023) | 200+ facilities | Towards Healthcare Database |
| FSED count growth since 2001 | 15x+ (50 → 770) | NEDI-USA / MedPAC / Ivy Clinicians |
| Total U.S. hospitals (FY2024) | 6,100 | AHA Fast Facts, 2026 edition |
| Total U.S. community hospitals (FY2024) | 5,12 | AHA Fast Facts, 2026 edition |
Table 1: The above-mentioned table represents the market indicators along with their value responsible for the rapid expansion of U.S. FSED. It states that total U.S. emergency department visits in 2022 were recorded to be 155 million, while in 2023 independent (non-hospital-affiliated) FSEDs were noted to have expanded beyond 200 facilities. Total U.S. freestanding EDs in 2024 accounted for approximately 770 facilities, where the FSED share of all U.S. EDs in the same year was reported to be 13.4%. Thus, the FSED count growth since 2001 reflected 15x rapid growth, expanding from 15 to 770 facilities. Additionally, in FY2024, total U.S. hospitals and total U.S. community hospitals were noted to be 6,100 and 5,121, respectively.
At least 32 states of the U.S. host some FSED presence, where Texas registered dominance by hosting approximately 338 facilities, which is driven by licensing rules that permit independent FSEDs to operate under a straightforward regulatory pathway.
|
Region / State
|
FSED Market Characteristics
|
|
Texas
|
Largest concentration nationally (~338 facilities, ~44% of U.S. total); handles ~25% of all in-state ED visits
|
|
Florida
|
Major expansion market; multiple 2024–2025 health-system FSED openings
|
|
Arizona
|
Established secondary hub for independent operators
|
|
Southeast (broader)
|
Fastest-growing regional emergency-care market per industry tracking
|
|
West
|
States relaxing FSED siting restrictions to counter rural hospital closures (e.g., California SB 588, March 2025)
|
|
Alaska and other constrained states
|
Minimal or no FSED presence due to regulatory and low-population-density constraints
|
Table 2: Based on our research, the table covers various states and regions in the U.S. with FSED facilities, where Texas held the major share with approximately 338 facilities and around 44% of total U.S. facilities, and it also handles approximately 25% of all in-state ED visits. Florida, on the other hand, is experiencing major expansion with multiple health-system FSED openings in 2024-2025, while Arizona is also contributing to significant growth due to the presence of established secondary hubs for independent operators. Southeast (broader) is rapidly expanding due to rising regional emergency-care market per industry tracking, while States relaxing FSED siting restrictions to counter rural hospital closures, such as California SB 588 March 2025 are driving West region growth. Moreover, Alaska and other constrained states showed minimal or no FSED presence due to regulatory and low-population-density constraints.
| Metric | Value | Source |
| Total U.S. hospitals (FY2024) | 6,100 | AHA Fast Facts, 2026 edition |
| Total U.S. community hospitals (FY2024) | 5,121 (84% of all hospitals) | AHA Fast Facts, 2026 edition |
| Total hospital-based EDs (2024, est.) | ~4,980 (86.6% of all EDs) | Ivy Clinicians, March 2024 |
| Total freestanding EDs (2024) | 770 (13.4% of all EDs) | Ivy Clinicians, March 2024 |
| Hospital-based EDs, 2005 vs. 2015 | 4,500 → 4,460 (200 closures, 138 mergers, 160 new) | Annals of Emergency Medicine / AHA Annual Survey |
| Rural hospitals closed since 2005 (Sheps Center definition) | 197 (109 complete + 88 converted) | UNC Sheps Center, 2025 |
| Net rural hospital reduction, 2017–2024 | -52 (62 closed vs. 10 opened) | KFF analysis of UNC Sheps Center data |
| Rural hospitals currently at risk of closure | ~734 (roughly 1 in 3 rural facilities) | CMS cost-report analysis, cited in The World Data, 2026 |
| Rural facilities converted to Rural Emergency Hospital (REH) status | 37 (19 in 2023, 18 in 2024) | UNC Sheps Center / KFF, 2025 |
Table 3: The table represents total hospitals, FSEDs, and their expanding facilities across the U.S. The total U.S. hospitals in FY2024 were reported to be 6100 and community hospitals were noted to be 5,121, accounting for 84% of all hospitals. 2024 also recorded 4,980 total hospital-based EDs, which is 86.6% of all EDs, where total freestanding EDs were noted to be 770, contributing to 13.4% of all EDs. The hospital-based EDs, 2005 vs. 2015, showed a rise from 4,500 to 4,460, including 200 closures, 138 mergers, and 160 new facility openings. Rural hospitals closed since 2005 are reported to be 197, which contributed to 109 complete with 88 conversions. Net rural hospital reduction from 2017 to 2024 showed a decrease of 52 hospitals. Rural hospitals currently at risk of closure cover approximately 734 facilities, while rural facilities converted to rural emergency hospital (REH) status accounted for 37 facilities, with 19 from 2023 and 18 from 2024.
| Metric | Value | Source |
| Total U.S. ED visits (2021) | 140 million | CDC/NCHS NHAMCS |
| Total U.S. ED visits (2022) | 155 million | CDC/NCHS NHAMCS |
| ED visit rate (2022) | 47 visits per 100 population | CDC/NCHS Data Brief No. 503 |
| Visits resulting in hospital admission (2022) | 11.5% (17.8 million visits) | CDC/NCHS FastStats |
| Visits resulting in critical care unit admission (2022) | 2.0% (3.1 million visits) | CDC/NCHS FastStats |
| Visits resulting in transfer to another hospital (2022) | 2.4% | CDC/NCHS FastStats |
| Overall ED length of stay (2022, all EDs, benchmarking survey) | 199 minutes (up from 182 minutes in 2021) | ACEP Now, “A First Look at Emergency Department Data for 2022” |
| Median ED boarding hours/day, academic EDs (2019 → 2023) | 206 → 332 hours/day (+61.1%) | AACEM/AAAEM benchmarking survey, cited in Academic Emergency Medicine, 2026 |
| EDs routinely reporting crowded conditions | >90% | ACEP, “Emergency Department Boarding and Crowding” |
Table 4: The total U.S. ED visits in 2021were reported to be 140 million, which increased to 155 million in 2022. The ED visit rate in 2022 was noted to be 47 visits per 100 population, where visits resulting in hospital admission, critical care unit admission, and transfer to another hospital contributed to 11.5%, 2.0%, and 2.4%, respectively. Furthermore, the overall ED length of stay was recorded to be 199 minutes. Median ED boarding hours/day in academic EDs experienced a rise between 2019 and 2022 from 206 to 332 hours/day, that is, a rise of 61.1%. Additionally, EDs crowded conditions in routine reports were recorded to be more than 90%.
The UNC Sheps Center and KFF data highlighted the clearest quantified access gap in the rural-urban areas, which recorded 197 rural hospital closures/conversions since 2005, with a net reduction of 52 facilities from 2017 to 2024, where around 734 rural hospitals contributing to one in three nationally are at high financial risk of closure. 69%, accounting for approximately two-thirds, were closed between 2014 and 2024 because they lacked Medicaid expansion, which linked coverage policy to emergency-care access gaps.
Source: KFF, “10 Things to Know About Rural Hospitals,” 2025 (analysis of UNC Sheps Center data)
|
Metric
|
Value
|
Source
|
|
ED visit rate, infants under 1 year (2022)
|
99 per 100 infants (highest of any age group)
|
CDC/NCHS Data Brief No. 503
|
|
ED visit rate, adults 75+ (2022)
|
76 per 100 adults
|
CDC/NCHS Data Brief No. 503
|
|
ED visit rate, Black/African-American non-Hispanic population (2022)
|
91 per 100 population (highest of any racial/ethnic group)
|
CDC/NCHS Data Brief No. 503
|
|
Adults with ≥1 ED visit in past 12 months (2022)
|
~20%
|
CDC/NCHS Data Brief No. 503
|
|
Children with ≥2 ED visits in past 12 months (2022)
|
~5%
|
CDC/NCHS Data Brief No. 503
|
|
ED visits with confirmed COVID-19 diagnosis (2022)
|
4.8% of all visits
|
CDC/NCHS Data Brief No. 503
|
|
U.S. adults who would delay/avoid ER care due to boarding concerns
|
43%
|
ACEP/Morning Consult poll, Oct. 2023
|
|
U.S. adults reporting prolonged wait after being seen, before admission/transfer
|
44% (16% of those waited 13+ hours)
|
ACEP/Morning Consult poll, Oct. 2023
|
Table 5: The table highlights the number of ED visits in 2022, where 99 per 100 infants under the age of 1 year were recorded as the highest age group for ED visits in 2022. Adults over the age of 75 years were noted to be 76 per 100 adults visiting the ED, where 91 per 100 of the population contributed to Black/African-American non-Hispanic population, making them the highest racial/ethnic group to visit the ED. Adults with above or equal to 1 year of age held approximately 20%, while children aged above or equal to 2 years were reported to contribute roughly 5%, while ED visits with a confirmed COVID-19 diagnosis accounted for 4.8% of all visits. 43% of U.S. adults delayed or avoided ER care due to boarding concerns, whereas 44% of adults reported prolonged wait after being seen and before admission/transfer.
| Metric | Value | Source |
| Total U.S. ED visits (2022) | 155 million | CDC/NCHS NHAMCS |
| Visits seen by a provider within 15 minutes (2022) | 40.6% | CDC/NCHS FastStats |
| Median ED boarding hours/day, academic EDs (2023) | 332 hours/day (up 61.1% from 2019) | AACEM/AAAEM benchmarking survey, 2026 |
| Boarding-to-attending physician hour ratio (2019 → 2023) | 2.97 → 4.62 (+55.6%) | AACEM/AAAEM benchmarking survey, 2026 |
| Overall ED length of stay (2022) | 199 minutes | ACEP Now, 2023 |
| Non-emergent share of FSED visits nationally | Just 2.3% of FSED visits are emergent or require services unique to an ED | UnitedHealth Group, “Freestanding Emergency Departments” brief, 2017 |
Table 6: As the market research analyst, I interpret that the total U.S. ED visits in 2022 were reported to be 155 million, where the overall length of stay was noted to be 199 minutes, while the visits seen by a provider within 15 minutes were 40.6%. In 2023, median ED boarding hours/day in academic EDs were reported to be 332 hours/day, where the boarding-to-attending physician hour ratio from 2019 to 2023 showed a rise from 2.97 to 4.62, surpassing 55.6%. Moreover, just 2.3% of FSED visits were reported to be emergent or required services unique to an ED.
|
Metric
|
Value
|
Source
|
|
Average FSED charge for a common condition (fever/sore throat), Texas
|
$3,217
|
UnitedHealth Group brief, 2017
|
|
Same condition, physician office
|
$146 (FSED charges 22x more)
|
UnitedHealth Group brief, 2017
|
|
Same condition, urgent care center
|
$167 (FSED charges 19x more)
|
UnitedHealth Group brief, 2017
|
|
Texas FSEDs charging a separate facility fee
|
93% (adds $1,000+ per visit)
|
UnitedHealth Group brief, 2017
|
|
Average patient out-of-pocket cost, Texas FSED
|
$800+ (vs. <$100 at physician office/urgent care)
|
UnitedHealth Group brief, 2017
|
|
Average patient out-of-pocket cost, Colorado FSED
|
$735 (vs. $65 physician office, $101 urgent care)
|
UnitedHealth Group, Colorado brief, 2017
|
|
Potential savings from shifting non-emergent FSED visits to lower-cost settings (Texas)
|
~95% cost reduction, $3,000+ saved per visit
|
UnitedHealth Group brief, 2017
|
|
Median allowed amount for an ER visit, network providers (2023)
|
~$1,700 (up to $1,500 more than a $165 urgent-care visit)
|
UnitedHealthcare 2023 network data
|
|
CMS Medicare Physician Fee Schedule 2024 conversion-factor change
|
Reported ~3.4% cut to marginal reimbursement, pressuring FSED payer-mix optimization
|
Mordor Intelligence industry analysis, 2025–2026 (secondary compilation of CMS PFS data)
|
Table 7: The above-mentioned table covers FSED charges, reimbursement support, out-of-pocket cost, and potential savings, where the average FSED charge for a common condition in Texas was $3,217, while the same condition in a physician office and urgent care center required $146 and $167, respectively. FSEDs in Texas charged a separate facility fee of more than $1,000 per visit, which accounted for 93%. Moreover, its Average patient out-of-pocket cost was reported to be more than $800, whereas physician office/urgent care required less than $100. Potential savings from shifting non-emergent FSED visits to lower-cost settings contributed to a 95% cost reduction, which saved more than $3,000 per visit. Average patient out-of-pocket cost for Colorado FSED was noted to be $735 compared to $65 for physician office and $101 for urgent care. The median allowed amount for an ER visit for network providers in 2023 was approximately $1,700, while the CMS Medicare Physician Fee Schedule 2024 conversion-factor change reported a roughly 3.4% cut to marginal reimbursement, pressuring FSED payer-mix optimization.
|
Company
|
Debt / Capital Metric
|
Outcome
|
|
Adeptus Health
|
~$400 million in liabilities at Chapter 11 filing (2017)
|
Chapter 11 → final Chapter 7 liquidation (2020)
|
|
Envision Healthcare
|
$7–7.7 billion in debt following 2017 KKR buyout ($9.9B purchase price)
|
Chapter 11 bankruptcy (2023); now lender-controlled
|
|
American Physician Partners (ED staffing, 150 hospitals)
|
$472 million in debt
|
Ceased operations Aug. 2023; 2,500 physicians left unpaid
|
Table 8: As per the information gathered by Aman, the table focuses on the debt load carried by major FSED-adjacent staffing and operating companies during their private-equity ownership periods. Adeptus Health in 2017 held approximately $400 million in liabilities at its Chapter 11 filing, which was converted into a final Chapter 7 liquidation in 2020. Envision Healthcare experienced $7-7.7 billion in debt after the 2017 KKR buyout, which had a $9.9B purchase price; Chapter 11 was filed in 2023, where it now contributes to lender control. American Physician Partners, with ED staffing and150 hospitals, was $472 million in debt, which led to ceased operations in August 2023, where 2,500 physicians left without getting paid.
Source: PMC, “Private Equity and the Ravaging of United States Health Care,” 2025; Wikipedia (Adeptus Health record); Ivy Clinicians, March 2024
The FSED-specific technology-adoption-rate data consisting of EHR penetration, telehealth integration, and point-of-care diagnostics adoption does not exist, as FSEDs are typically embedded within EHR/IT infrastructure of their parent health systems or run as standalone commercial platforms. This, in turn, reflects the significant gap in technology or digital transformation in U.S FSED facilities
The physician-staffing layer is one of the major documented value-chain structures in the FSED industry. Envision Healthcare and TeamHealth are the two leading companies in the market, where they contribute to approximately 40% of all employed U.S. physicians in emergency medicine and adjacent specialties, focusing on employment or contract with staffing arrangements, bargaining power, and operational control at the company level. The direct documented example of this integration is represented by HCA Healthcare Valesco joint venture, which combines HCA owned facilities with Envision restructured staffing operation.
Source: PMC, “Private Equity and the Ravaging of United States Health Care,” 2025; Ivy Clinicians, March 2024
| Metric | Value | Source |
| HCA Healthcare combined ED network | 182 hospital-based + 110+ freestanding EDs | Ivy Clinicians, March 2024 |
| Envision Healthcare (restructured) managed EDs | 382 facilities | Ivy Clinicians, March 2024 |
| U.S. hospitals currently owned by private equity firms | ~460 (8% of all private hospitals; 22% of for-profit hospitals) | PMC, “Implications of Private Equity Investment in Emergency Medicine,” 2025 |
| Share of PE-owned hospitals serving rural populations | 26% | PMC, 2025 (citing PESP Private Equity Hospital Tracker) |
| Share of employed U.S. physicians covered by the two largest EM staffing groups | ~40% | PMC, “Private Equity and the Ravaging of United States Health Care,” 2025 |
Table 9: The above-mentioned table compares various organizations and their facilities present in the U.S. HCA Healthcare combined ED network, which consists of 182 hospital-based and 110+ freestanding EDs, while Envision Healthcare held 382 facilities. U.S. hospitals currently owned by private equity firms contributed to approximately 460 facilities with 8% of all private hospitals and 22% of for-profit hospitals. The share of PE-owned hospitals serving rural populations was 26%, while the share of employed U.S. physicians covered by the two largest EM staffing groups was reported to be approximately 40%.
|
Metric
|
Value
|
Source
|
|
Global healthcare private equity investment (2024)
|
$115 billion (up from $83 billion in 2021)
|
PMC, 2025 (citing Bain & Company PE healthcare data)
|
|
Cumulative PE investment in U.S. healthcare, prior decade
|
>$1 trillion
|
Private Equity Stakeholder Project, Hospital Tracker, 2025
|
|
Envision Healthcare KKR buyout value (2017)
|
$9.9 billion
|
Multiple sources: Ivy Clinicians; PMC, 2025
|
|
American Physician Partners collapse (2023)
|
$472M debt; 150 hospitals affected; 2,500 physicians left unpaid
|
PMC, “Private Equity and the Ravaging of United States Health Care,” 2025
|
|
Adeptus Health private-equity extraction (Sterling Partners)
|
$641 million returned on a $57 million initial investment, per court filings
|
Bloomberg Law, 2019
|
Table 10: Based on the survey conducted, the table highlights investments, M&A, and other transactions contributing to market growth. In 2024, global healthcare private equity investment was noted to be $115 billion, which increased from $83 billion in 2021, whereas the cumulative PE investment in U.S. healthcare was recorded to be more than $1 trillion. Envision Healthcare KKR buyout value in 2017 was reported to be $9.9 billion, where Adeptus Health private-equity extraction noted $641 million returned on a $57 million initial investment, per court filings. American Physician Partners collapsed in 2023 with $472M in debt, which affected 150 hospitals, resulting in the resignation of 2,500 physicians without getting paid.
April 11, 2024, Texas hosts 338 freestanding EDs handling nearly a quarter of all in-state ED visits was confirmed by the study comparing FSED and hospital-based ED visit characteristics, which was published by Texas A&M University School of Public Health
Source: Texas A&M University, Vital Record
In May 2023, with a burden of $7-7.7 billion in debt after the 2017 KKR buyout, Envision Healthcare filed for Chapter 11 bankruptcy, where the restructured company is now being controlled by Centerbridge Partners and Blackstone.
Source: Ivy Clinicians, March 2024; PMC, 2025
In August 2023, the $472 million in debt of American Physician Partners, which is an emergency-medicine staffing group serving 150 hospitals, was announced to have ceased its operations, resulting in leaving 2,500 physicians and support staff without months of back pay.
Source: PMC, “Private Equity and the Ravaging of United States Health Care,” 2025
In October 2023, due to boarding concerns, 43% of U.S. adults would delay or avoid emergency care, while 44% of the population have already experienced prolonged post-treatment waits before admission or transfer, as published by ACEP and Morning Consult.
Source: ACEP Newsroom, Oct. 2023
In March 2024, a confirmation was provided by industry workforce tracking that the U.S. now houses 770 freestanding EDs, which is 13.4% of all EDs, along with HCA Healthcare operating 182 hospital-based and more than 110 freestanding EDs.
Source: Ivy Clinicians / Emergency Medicine Workforce Newsletter
In October 2024, a national summit on emergency department boarding after years of ACEP advocacy and an HHS-announced national boarding task force was organized by the Agency for Healthcare Research and Quality (AHRQ).
Source: ACEP, “Emergency Department Boarding and Crowding”
In 2025, a total of 197 rural hospital closures/conversions since 2005 were announced by the UNC Sheps Center, which also highlighted that 2017-2024 experienced a net reduction of 52 facilities, while roughly 734 rural hospitals are now classified as at financial risk of closure.
Source: UNC Sheps Center; KFF, 2025; The World Data, 2026
In March 2025, a statewide study to deploy freestanding emergency departments, mitigating healthcare deserts across rural and inland counties, was proposed by California Senate Bill 588.
Source: Mordor Intelligence industry analysis, 2025–2026
It is the largest U.S. hospital operator with 182 hospital-based EDs and more than 110 freestanding EDs, which extensively focuses on combining its networks.
It is an emergency medicine physician-staffing group that was taken private by KKR for $9.9B in 2017 and is now responsible for managing 382 EDs under new lender ownership.
It is the well-known former largest independent freestanding ER chain in the U.S., which grew from 15 to approximately120 facilities in just three years (2012-2015), where 2020 marked its Chapter 7 liquidation.
It is the former ED physician-staffing group that covered 150 hospitals until its operations ceased in 2023 under $472M in debt.
It is the major physician-staffing group for hospital-based and freestanding EDs, and it includes around 40% of employed U.S. physicians in EM and adjacent specialties.
It is a regional nonprofit hospital system and active FSED network operator in North Texas, which is continuously expanding its freestanding ED network across the region.
It is the operator of “neighborhood emergency hospitals” partnering with regional health systems to expand across multiple states.
It is the major commercial payer and publisher of the primary public research on FSED cost/pricing, where it published briefs quantifying FSED cost premiums in 2017.
It is the academic health services research center and an authoritative source for rural hospital closure tracking, which tracks all U.S. rural hospital closures/conversions since 2005.
It is a federal statistical agency operating NHAMCS, which is the primary source of national ED utilization data, and is responsible for publishing annual ED visit-rate data.
It is the primary professional association for U.S. emergency physicians, where it also controls national boarding-crisis advocacy and has published the 2023 Morning Consult poll on boarding and access.
| Segment | Defining Characteristic | Verified Data Point |
| Off-Campus Emergency Department (OCED) | Hospital-licensed satellite ED; eligible for Medicare facility-fee reimbursement since a 2004 CMS policy change | Structural majority of the 770 total FSEDs, per Western Journal of Emergency Medicine, 2020 |
| Independent Freestanding ED (IFSED) | Operates outside a hospital license; reimbursement depends on state licensure and commercial payer contracts | 200+ facilities operating nationally as of 2023, per Towards Healthcare Database |
| Patient Age (Infants) | Highest-utilization age cohort | 99 ED visits per 100 infants (2022), CDC/NCHS |
| Patient Age (75+) | Second-highest-utilization age cohort | 76 ED visits per 100 adults 75+ (2022), CDC/NCHS |
| Patient Acuity (Admission-Driving) | Share of visits requiring hospital-level resources | 11.5% of visits result in hospital admission (2022), CDC/NCHS |
| Patient Acuity (Non-Emergent, FSED-treatable) | Share of FSED visits that are genuinely emergent | Only 2.3% of FSED visits nationally require services unique to an ED, UnitedHealth Group, 2017 |
Table: As the market research analyst, I interpret that the table specifies a granular segmentation hierarchy, where the off-campus emergency department (OCED) segment held the major share due to the presence of 770 total FSEDs, as mentioned in the Western Journal of Emergency Medicine 2020, where this hospital-licensed satellite ED also offered Medicare facility-fee reimbursement since the CMS policy change in 2004. The independent freestanding ED (IFSED) segment is responsible for operating outside a hospital license, covering more than 200 facilities nationally as of 2023, where it also offers reimbursement for state licensure and commercial payer contracts. Based on patient age, the infant subsegment contributed to the highest utilization age group, with 99 ED visits per 100 infants in 2022, while adults aged more than 75 years were the second-highest-utilization age group, with 76 ED visits per 100 adults. In patient acuity, admission-driving visits held the major share, with 11.5% of visits resulting in hospital admission due to growing visits requiring hospital-level resources, while non-emergent, FSED-treatable visits held 2.3% of FSED visits nationally, which were genuinely emergent and required services unique to an ED.
Aditi is a healthcare services research expert with strong experience in healthcare facilities, emergency services, and reimbursement policy markets. She conducted detailed market research, analyzed company data, clinical trends, and industry developments. Based on her comprehensive analysis, the following strategic key takeaways highlight the most important market insights and opportunities.
For Companies/Organizations
For Investors & Corporate Strategy Teams
Based on my assessment, the market is expanding rapidly due to growing chronic diseases, which are leading to an increase in emergency conditions. The growth in the infant patient population will drive the demand for faster and more efficient emergency services, increasing the dependence on FSEDs. I also anticipate that the new collaboration and M&A among the facilities and organizations will enhance access to their services. I also see strong growth in reimbursement support and infrastructure improvement, which will create new market opportunities.
Payal Rabde led the primary market research, developed the methodology, analyzed trends, segmentation, competition, forecasts, and strategic opportunities, forming the report analytical foundation.
Aman was responsible for collecting and validating clinical trial data, research publications, company information, partnerships, and other quantitative datasets, strengthening evidence-based analysis and market estimations.
Aditi reviewed the complete research document, performed quality checks, validated findings, refined content, corrected inconsistencies, and finalized the report, ensuring accuracy, clarity, credibility, and publication-ready quality.
By Ownership
By Service
By Facility Model
By Patient Acuity
By Payer
By Patient Age
Speak with a healthcare analyst about your research, consulting, or platform needs.




 sales@towardshealthcare.com