
Find the Right Market Report
Search thousands of industry reports, market insights, and research studies in one place.
Search thousands of industry reports, market insights, and research studies in one place.
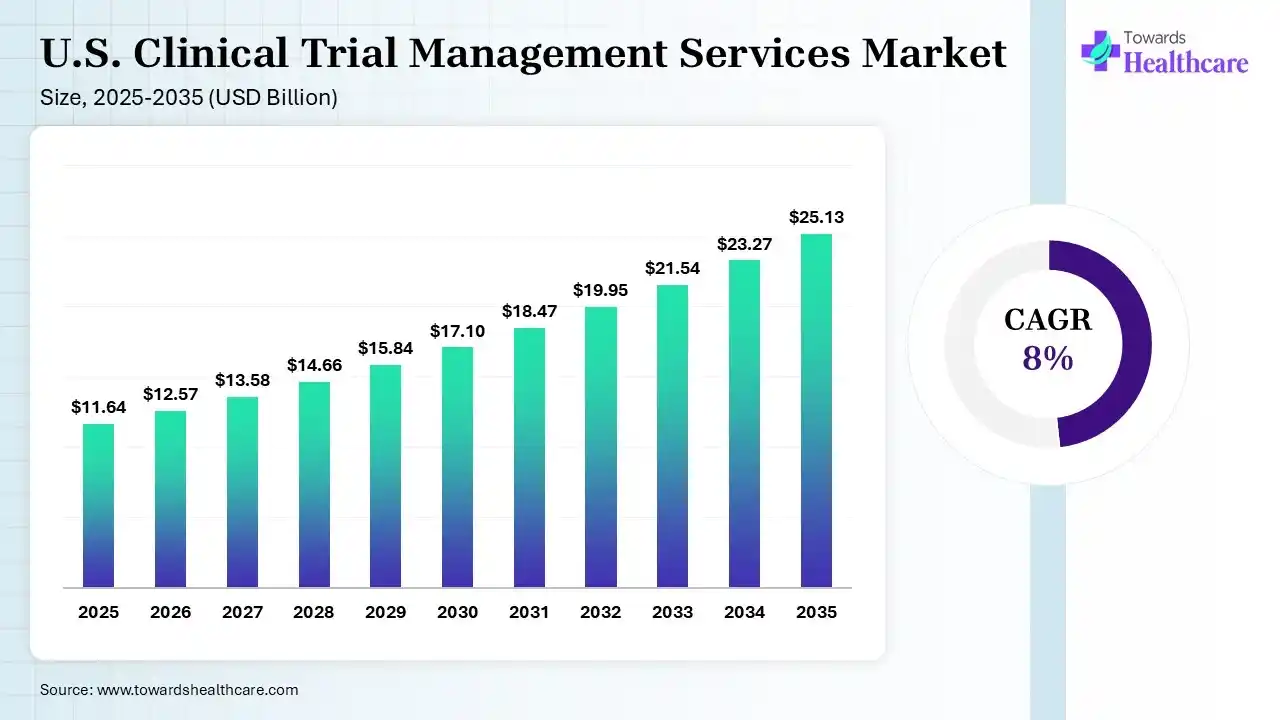
According to Payal Rabde, who specializes in research related to clinical trials, decentralized trials, and healthcare services, with 5+ years of experience in market research and industry analysis, extensive research indicates strong growth opportunities in the U.S. clinical trial management services market. The U.S. clinical trial management services market size was estimated at USD 11.64 billion in 2025 and is predicted to increase from USD 12.57 billion in 2026 to approximately USD 25.13 billion by 2035, expanding at a CAGR of 8% from 2026 to 2035. Her analysis highlights that the U.S. clinical trial management services market is rapidly expanding due to growing clinical trial activities, increasing trial costs, growing acquisitions, focus on decentralized trials, regulatory requirements, and key industry players like IQVIA Holdings Inc., ICON plc, Fortrea, Medpace Holdings, Inc., and Syneos Health.

The U.S. clinical trial management services (CTMS) encompass the outsourced operational functions such as monitoring, regulatory submissions, data management, medical writing, site management, and project management, which are offered by contract research organizations (CROs) and specialized service providers to execute clinical trials. They help accelerate trial execution, improve patient retention, enhance data integrity, reduce operational costs, and ensure regulatory compliance.

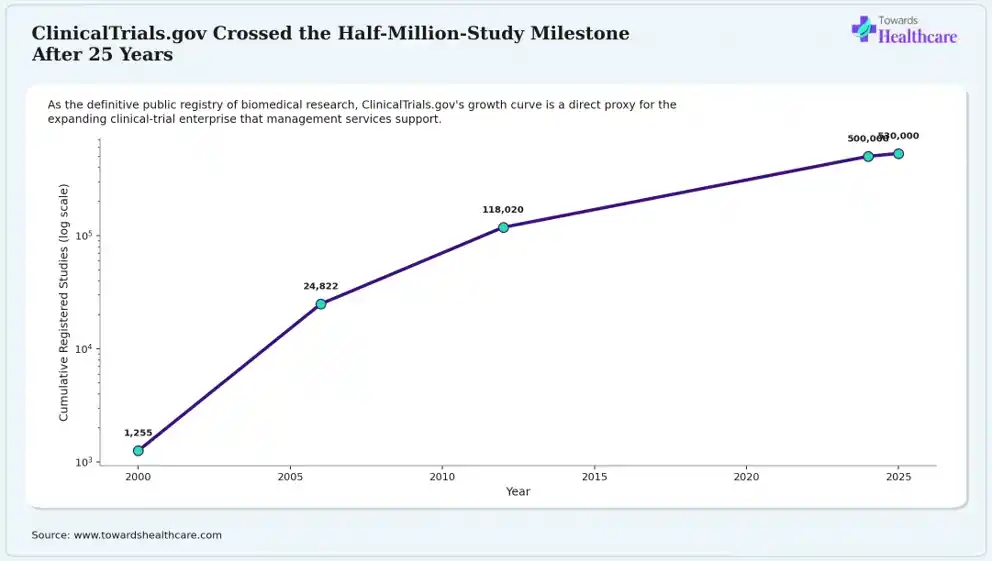
Graph 1: As the market research analyst, I interpret that the given line chart illustrates cumulative registered studies from 2000 to 2025, which shows a gradual rise. In the year 2000, the number of cumulative registered studies was reported to be 1,255, which increased to 24,822 by 2006. 2012 recorded 118,020 cumulative registered studies, which surpassed 500,000 in 2024, while 2025 contributed to more than 530,000 studies. These growing clinical activities are directly responsible for expanding the clinical-trial enterprise that management services support.
Key Insight:
The growing clinical trials have expanded the clinical-trials enterprise roughly 400-fold since 2000, along with clinical trial management providers, which are the operational center of this expanding registry-tracked infrastructure.
Source: National Library of Medicine, “ClinicalTrials.gov: A 25-Year Journey to a Half-Million Registered Studies,” April 2025.

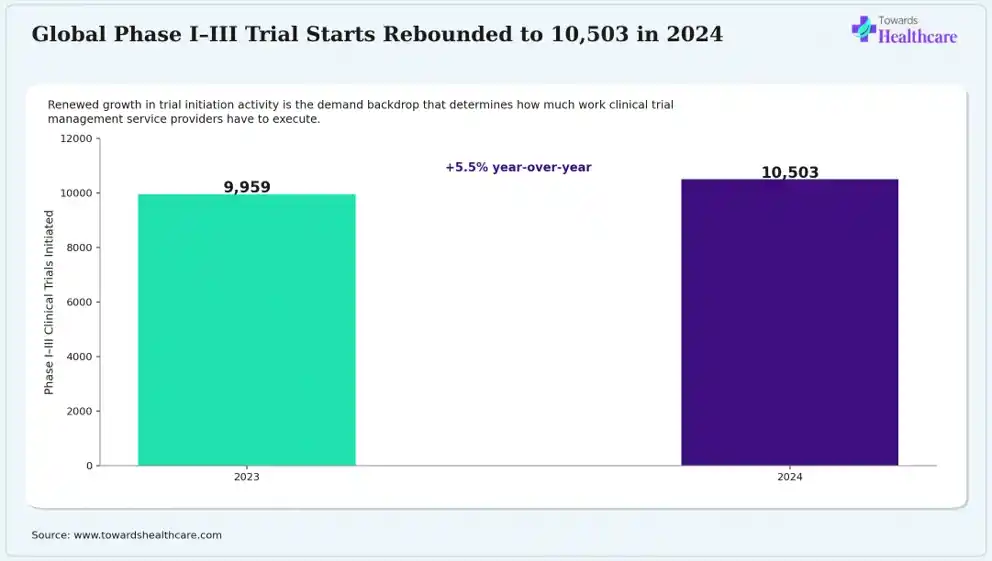
Graph 2: The bar chart compares phase I-III clinical trial initiations in 2023 and 2024, highlighting significant growth that increased the dependence on clinical trial management service providers. The total number of phases I-III trials initiated in 2023 was reported to be 9,959, which increased to 10,503, that is, by more than 5.5%, in 2024.
Key Insight:
The steady post-pandemic recovery in trial-start volume reflects the sustained demand for outsourced operational services.
Source: Citeline, “The Annual Clinical Trials Roundup, 2025 Edition,” 2025.

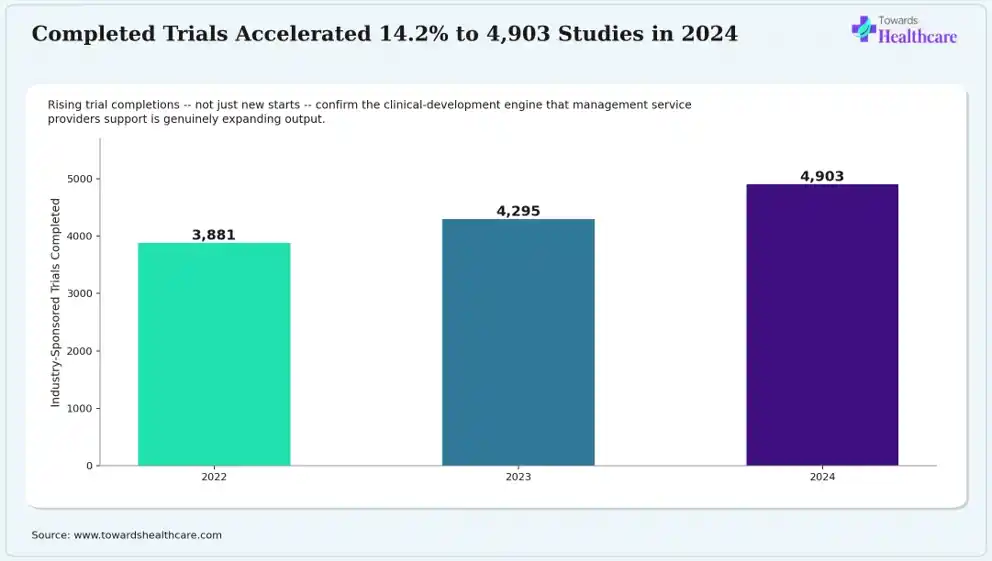
Graph 3: Based on the given bar chart, I analyse that completed trials from 2022 to 2024 demonstrate gradual growth. In 2022, the industry sponsored trails completed were reported to be 3,881, which increased to 4,295 in 2023. Additionally, 2024 covered 4,903 industry sponsored trails completion, which increased the use of various clinical trial management services.
Key Insight:
The rapid growth in completed-trial volume in eight years indicates that management service providers are effectively concluding out trials.
Source: Citeline, “Infographic: Annual Completed Clinical Trials,” 2025.

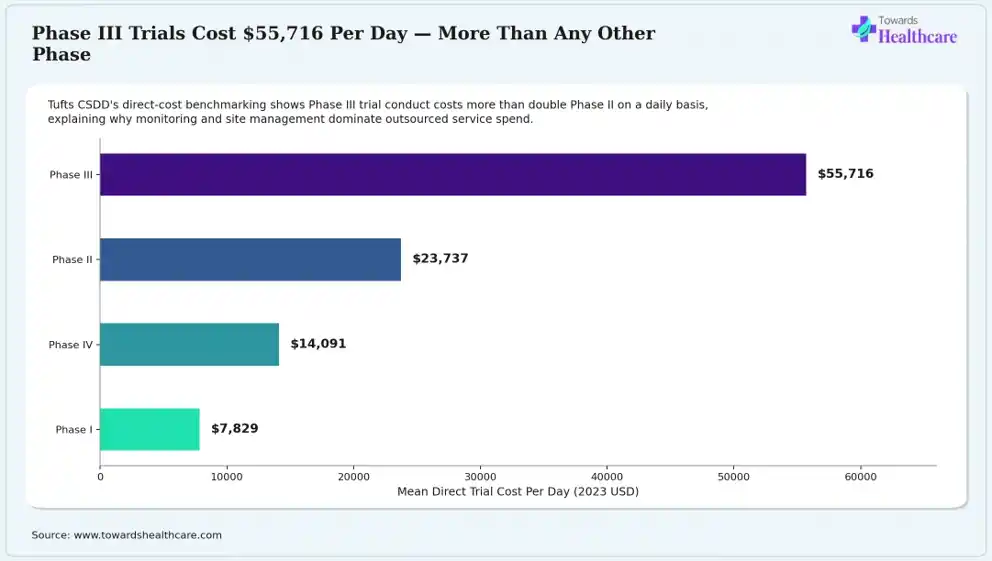
Graph 4: Based on our research, the above-mentioned horizontal bar chart covers the mean direct trial cost per day by phase. In 2023, Phase I trial held $7,829 mean direct trial cost per day, while Phase II contributed $23,737. Phase III had the highest mean direct trial cost per day, accounting for $55,716, whereas Phase IV was reported to require $14,091 mean direct trial cost per day. Therefore, by Tufts CSDD's direct-cost benchmarking, the Phase III trial was reported to cost more than double Phase II on a daily basis, contributing to a rise in outsourced service spend.
Key Insight:
The high cost associated with Phase III, which was more than 7x Phase I, increased disclosed CRO service revenue and encouraged the sponsors to prioritize experienced full-service providers for pivotal trials.
Source: Tufts CSDD, 2024 white paper (447 protocols, 2016–2021 data inflated to 2023 dollars), cited in DataAlly clinical trial enrollment statistics roundup, 2026.

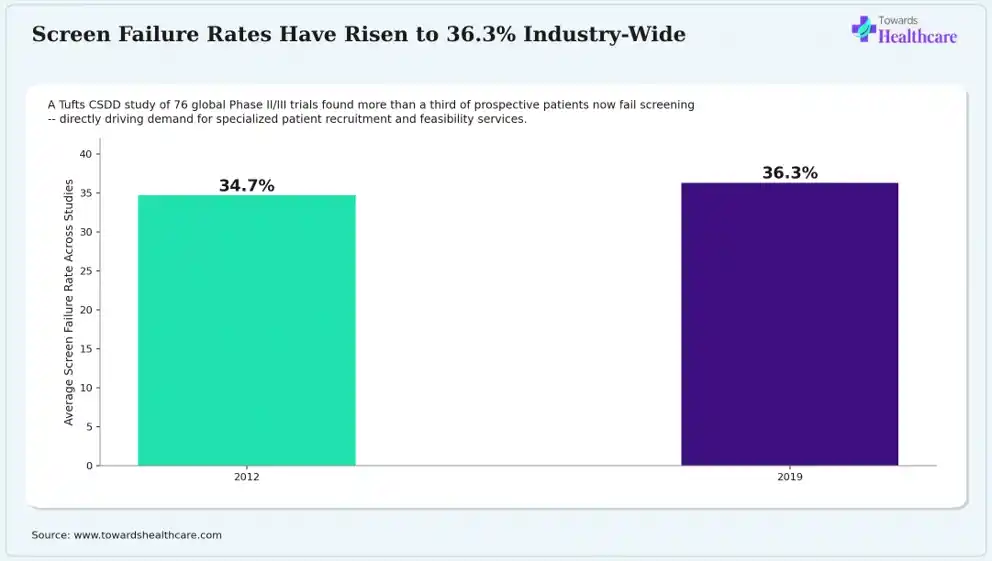
Graph 5: As per the survey conducted, the bar chart compares the average screen failure rates for the years 2012 and 2019, which demonstrates a slight increase. In 2012, the average screen failure rate was noted to be 34.7%, which increased to 36.3% in 2019, indicating that more than a third of prospective patients now fail screening, driving the demand for specialized patient recruitment and feasibility services.
Key Insight:
Rising screen failure rates across rare diseases and targeted subpopulations act as the direct, quantified growth driver for outsourced patient recruitment services.
Source: Tufts CSDD, cited in Applied Clinical Trials, “Can Recruitment and Retention Get Any Worse?” (20 pharma companies, 76 trials, 7,085 sites).

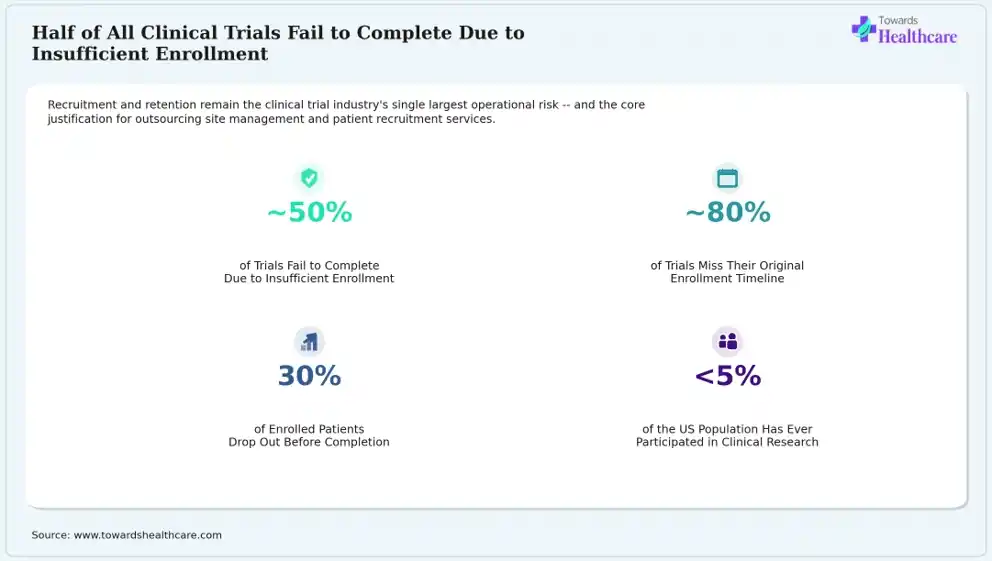
Graph 6: The infographic stat panel covers enrollment and completion challenge metrics. Trials failing to complete due to insufficient enrollment contributed to approximately 50%, while trials missing the original enrollment timeline contributed to approximately 80%. Enrolled patients who drop out before completion accounted for 30%, whereas the U.S. population that has ever participated in clinical research was noted to be less than 5%. This highlights that recruitment and retention are the major obstacles in clinical trials, which promotes the demand for outsourcing site management and patient recruitment services.
Key Insight:
Patient recruitment and retention services are considered a core determinant of whether a sponsor's trial succeeds or not, as roughly half of all trials are failing to complete due to lack of enrollments.
Source: Tufts CSDD, cited in Clinical Leader, “Tufts Finds Substantial Net Benefits To Using Decentralized Trials,” 2025.

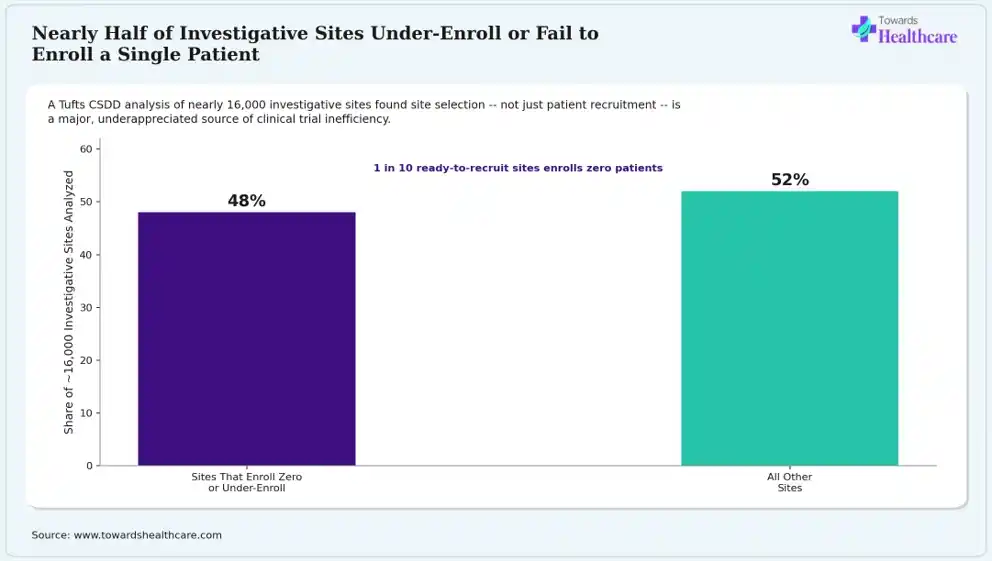
Graph 7: Based on the information gathered by Aman, the bar chart highlights site enrollment performance distribution. The sites that enroll zero patients or under-enroll held 48% of the share of approximately 16,000 sites analyzed, while all other sites held 52%. Furthermore, sites enrolling zero patients despite being “ready to recruit” contributed to 1 in 10, indicating site selection as a major, underappreciated source of clinical trial inefficiency.
Key Insight:
Site identification and selection services are critical to trial success, as nearly half of all investigative sites fail to meet enrollment expectations.
Source: Tufts CSDD, cited in DataAlly clinical trial enrollment statistics roundup, 2026.

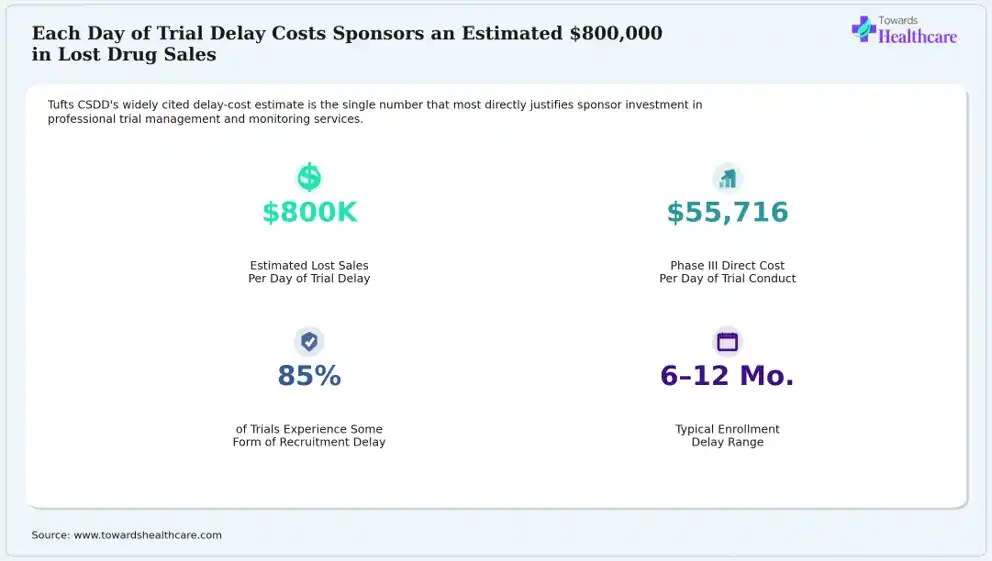
Graph 8: As the survey conducted by Aman, the infographic stat panel illustrates cost-of-delay metrics. The estimated lost sales per day of trial delay were $800,000, while Phase III direct cost per day of trial conduct contributed $55,716. Trials experiencing some form of recruitment delay were noted to hold 85%, while the typical enrollment delay range was between 6-12 months.
Key Insight:
The delay costing accounts for roughly 14x more per day in lost sales than it costs to run the trial itself, which highlights that professional trial management services focus less on cost minimization than on timeline protection.
Source: Tufts CSDD, cited in AutoCruitment, “How to Reduce Screen Fail Rates,” 2026.

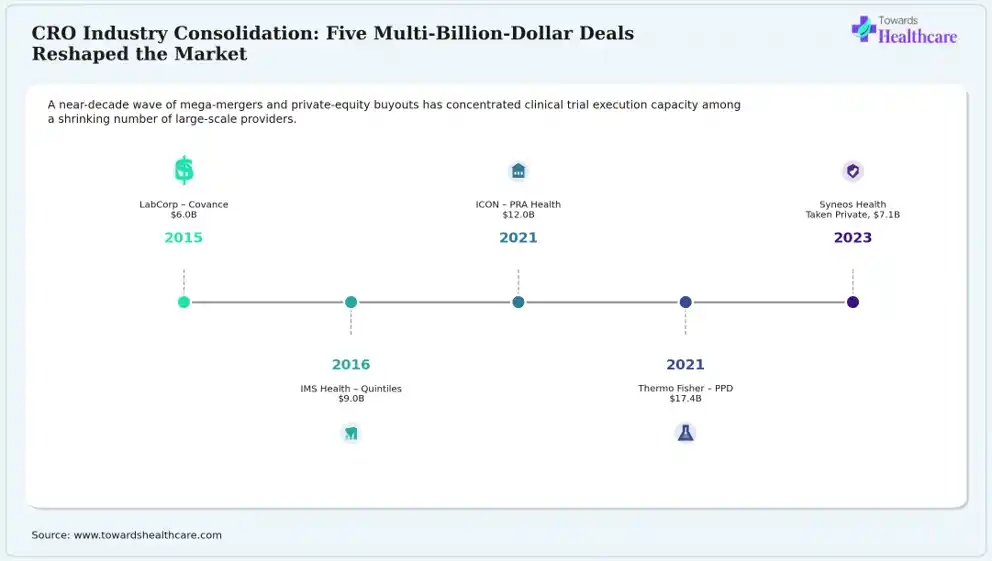
Graph 9: As the market research analyst, I interpret that the provided timeline infographic covers major CRO M&A deals from 2015 to 2023. In 2015, LabCorp’s Covance contributed $6.0 billion, while 2016 noted the IMS Health- Quintiles merger, which accounted for $9.0 billion. In 2021, the ICON-PRA Health Sciences and Thermo Fisher - PPD acquisition contributed $12.0 billion and $17.4 billion, respectively. In 2023, Syneos Health was taken private for $7.1 billion, as these mergers and private-equity buyouts are concentrating clinical trial execution capacity.
Key Insight:
Concentrating clinical trial execution capacity due to five deals worth a combined $51.5 billion is expanding options for outsourced trial management for organization sponsors.
Source: BioPharma Dive, “Icon to buy contract researcher PRA Health for $12B,” 2021; Healthcare Dive, “Syneos to be taken private in $7.1B deal,” 2023.

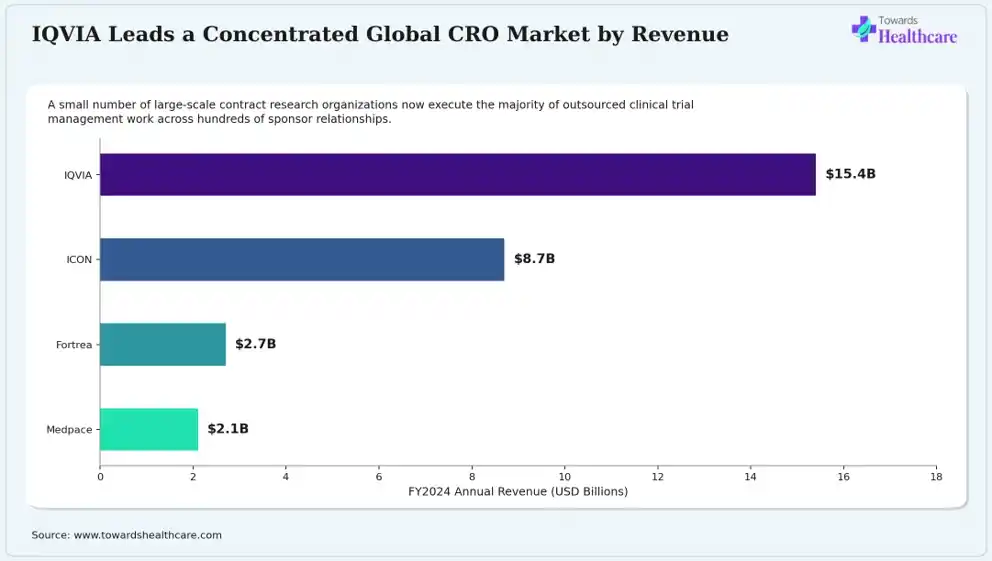
Graph 10: The horizontal bar chart represents top global CRO revenue for FY2024. IQVIA Holdings dominated the market with $15.4 billion in FY2024 revenue, while ICON plc held the second position with approximately $8.7 billion. On the other hand, Fortrea contributed $2.7-$3.1 billion of FY2024 revenue, while Medpace Holdings held its position with $2.109 billion.
Key Insight:
IQVIA's revenue scale reflects almost double the next-largest CRO, strengthening its trial operations across hundreds of sponsor relationships.
Source: Company FY2024 financial reports (IQVIA, ICON, Fortrea, Medpace).

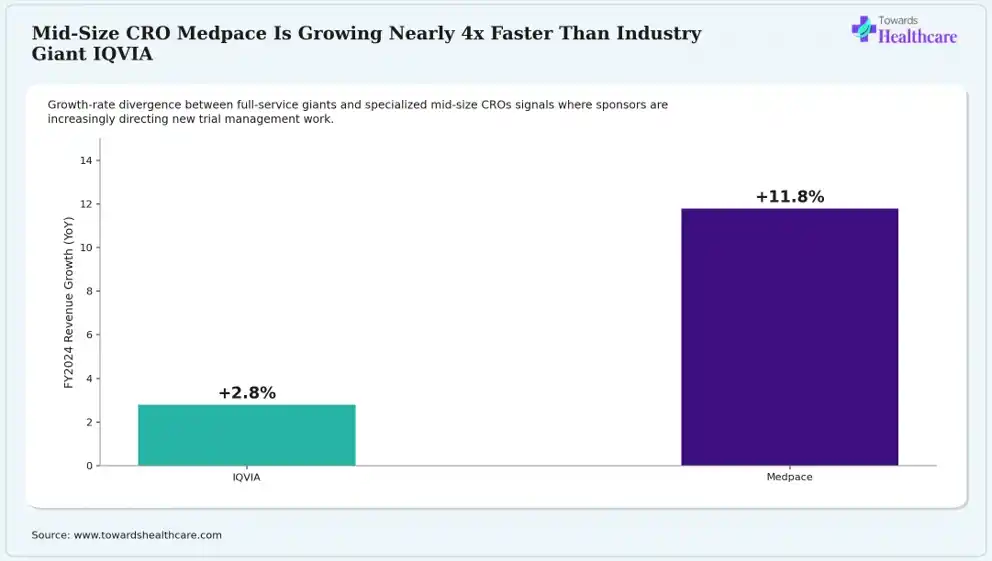
Graph 11: The above-mentioned bar chart illustrates the FY2024 YoY revenue growth comparison, which indicates gradual growth and expanding new trial management work. IQVIA Holdings contributed to FY2024 revenue growth (YoY), which increased by 2.8%, while Medpace Holdings registered a rise of 11.8%.
Key Insight:
The exponential growth of Medpace highlights its growing focus on small-to-mid-size biotech sponsors, making it the major player for outsourced clinical trial demand.
Source: Company FY2024 earnings reports; Clinical Outsourcing Group CRO revenue analysis, 2025.

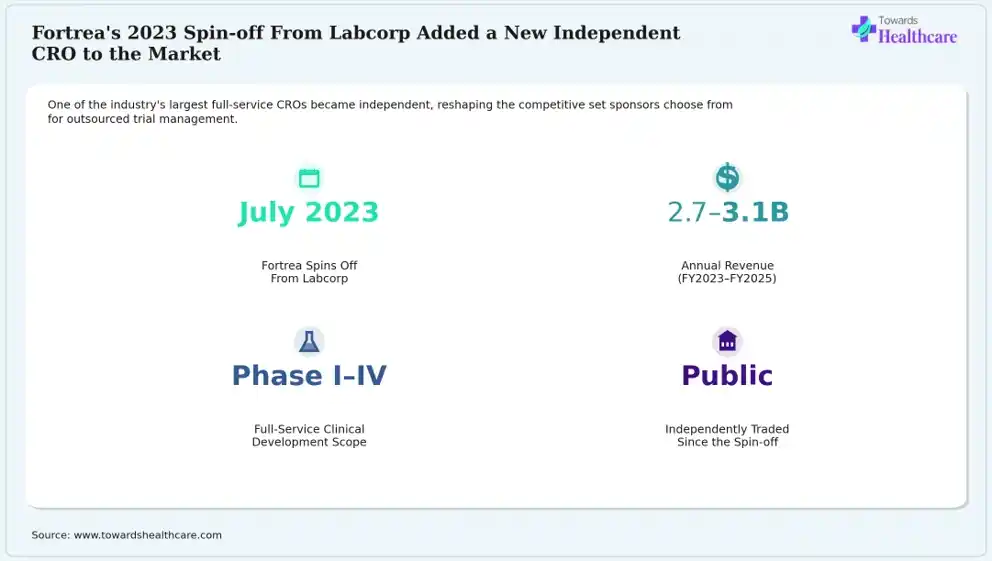
Graph 12: As per our research infographic stat panel, covers Fortrea spin-off metrics information, making it the largest and independent full-service CRO for outsourced trial management. July 2023 was recorded as its Spin-off date, while its annual revenue for FY2023 to FY2025 was reported to be $2.7-$3.1 billion. Furthermore, its service scope included Phase I-IV full-service clinical development, while its public status represents it as independently traded since spin-off.
Key Insight:
The rise of new, independently capitalized, multi-billion-dollar CRO significantly shifted sponsors' choice for late-stage trial execution.
Source: Pharmaboardroom, “Top 10 CROs in 2024”; IntuitionLabs, “CRO Market Share 2026.”

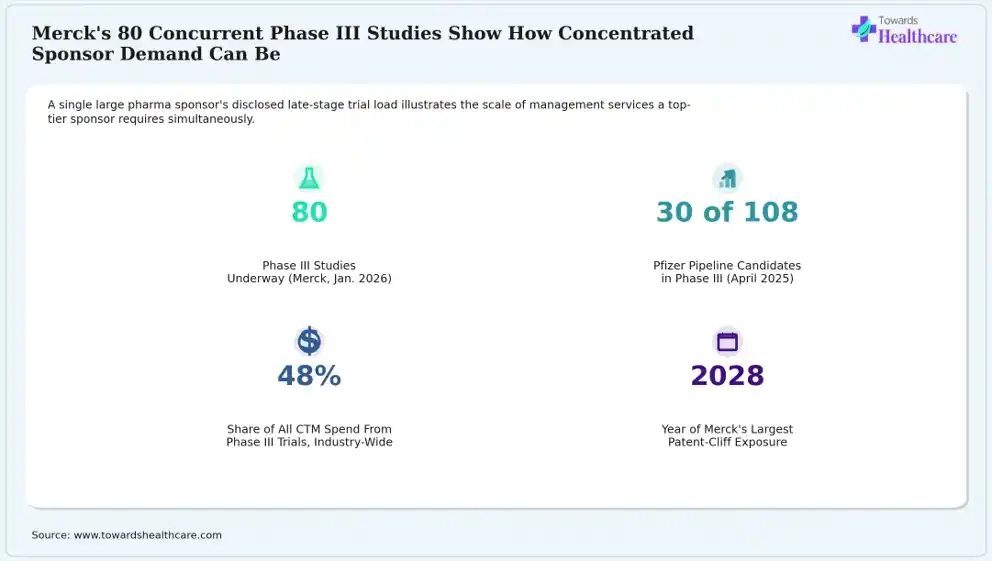
Graph 13: The infographic stat-panel encompasses large-sponsor Phase III trial scale metrics. In January 2026, Merck Phase III studies accounted for 80, while in 2025, Pfizer pipeline candidates in Phase III were 30 out of 108 candidates. Industry-wide CTM spend from Phase III trials was reported in Plurality share, per Tufts CSDD phase-cost data, where Merck's largest patent-cliff exposure year is expected to be 2028.
Key Insight:
A single sponsor like Merck contributing to 80 concurrent Phase III studies requires an enormous, coordinated base of site management, data management, and monitoring services, which highlights the growing dependence of top-20 pharma relationships on CRO revenue.
Source: PharmaLive, “2026 Pipelines to Watch,” Jan. 2026; SyneticX, “Pfizer 2026 Competitive Outlook Report.”

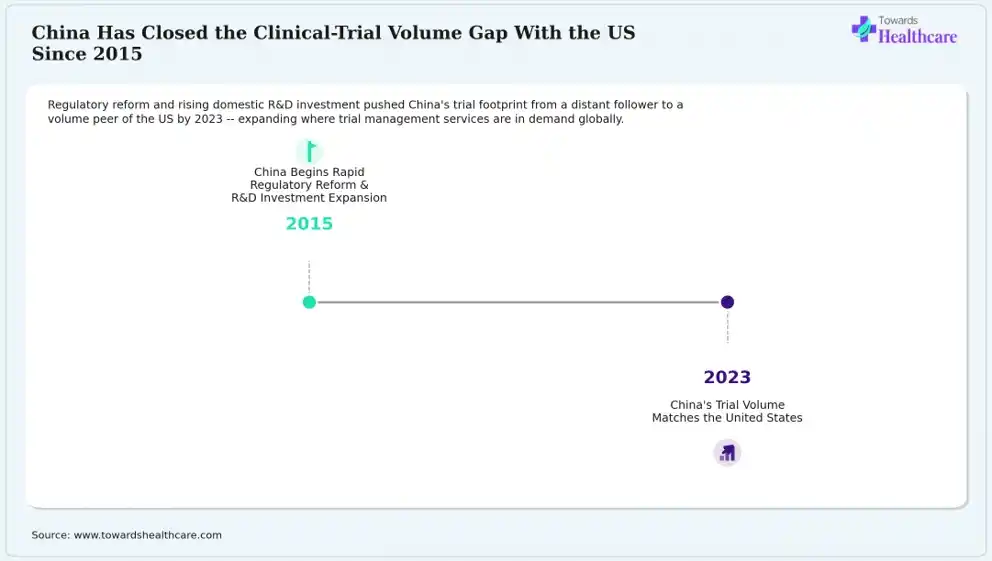
Graph 14: Based on the analysis conducted by Aman, the given timeline visual illustrates China's clinical trial volume milestones from 2015 to 2023. In 2015, China began rapid regulatory reform and R&D investment expansion, while in 2023 it reported a rise in clinical trial volume that matched the U.S., representing a rapid expansion of trial management services due to regulatory reform and rising domestic R&D investments.
Key Insight:
With the rise in China's clinical trial volume and trial management services have rendered any assessment of global clinical trial management service demand that ignores China structurally incomplete, making trial-site and sponsor activity a two-region story.
Source: Citeline (In Vivo), “By The Numbers: Phase III Trials In China Skyrocket While Phase I Falls To Earth,” Aug. 2025.

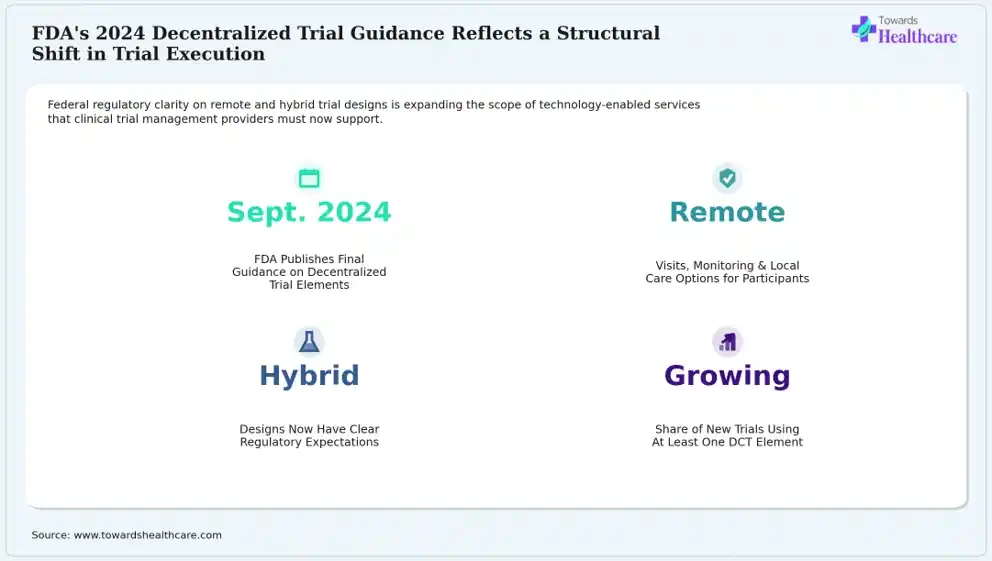
Graph 15: As the market research analyst, I interpret that the infographic stat panel illustrates FDA decentralized trial guidance metrics, clarifying remote and hybrid trial designs, expanding the scope of technology-enabled services. The guidance publication date was recorded as September 2024, and its scope highlighted remote visits, monitoring, and local care options for participants. The trial design impact resulted in clearer regulatory expectations for hybrid designs, while the service impact focused on the growing share of new trials utilizing at least one decentralized element.
Key Insight:
Remote monitoring and virtual visits are formalized as a standard trial design option in the final FDA guidance on decentralized elements, expanding the technology and remote-monitoring service lines CTM providers must offer.
Source: FDA, “FDA Publishes Final Guidance on Conducting Clinical Trials with Decentralized Elements,” Sept. 18, 2024.
This section covers market size with the use of verifiable structural and financial indicators from the underlying CRO industry and trial-volume base.
| Indicator | Value | Source |
| Cumulative registered studies, ClinicalTrials.gov (2025) | 530,000+ | National Library of Medicine, 2025 |
| Global Phase I–III trial starts (2024) | 10,503 (+5.5% YoY) | Citeline, 2025 |
| Industry-sponsored trial completions (2024) | 4,903 (+14.2% YoY) | Citeline, 2025 |
| Largest global CRO revenue (IQVIA, FY2024) | $15.4 billion | Company FY2024 filing |
| Combined value of 5 major CRO M&A deals, 2015–2023 | $51.5 billion | BioPharma Dive; Healthcare Dive, 2021–2023 |
| Phase III direct trial cost (mean, per day) | $55,716 | Tufts CSDD, 2024 |
Table 1: Based on the information I gathered, the cumulative registered studies in 2025 were reported to be more than 530,000, where global phase I-III trials initiated in 2024 were recorded to be 10,503. The industry-sponsored trial completions as of 2024 contributed 4,903, where the phase III direct trial cost per day was noted to be $55,716. Additionally, the largest global CRO revenue, as per IQVIA, FY2024, was reported to be $15.4 billion, where the combined value of 5 major CRO M&A deals, from 2015 to 2023, accounted for $51.5 billion.
This section focuses on the U.S. Clinical Trial Ecosystem and Market Structure and U.S. Clinical Trial Activity and Procedure Volume Analysis.
The clinical trial ecosystem, in compliance with FDA and ICH guidance, consists of three core parties, namely the sponsor who owns the drug and trial data, the CRO or service provider that executes operational functions, and the investigative site responsible for enrolling and treating patients.
| Metric | Value | Source |
| Combined value of major CRO consolidation deals, 2015–2023 | $51.5 billion across 5 deals | BioPharma Dive; Healthcare Dive, 2021–2023 |
| Fortrea independence from Labcorp | July 2023 spin-off | Pharmaboardroom, 2024 |
| Largest CRO by revenue (structural market leadership) | IQVIA, $15.4B FY2024 | Company FY2024 filing |
Table 2: Our research highlights the combined value of major CRO consolidation deals from 2015 to 2023 held $51.5 billion across 5 deals. Fortrea's independence from Labcorp was noted at the July 2023 spin-off, while the largest CRO by revenue was considered IQVIA, which contributed to structural market leadership with $15.4B in FY2024.
| Metric | Value | Source |
| Cumulative registered studies, ClinicalTrials.gov | 530,000+ (March 2025) | National Library of Medicine, 2025 |
| Interventional trials specifically registered | 404,637 (March 2025) | DataAlly clinical trial enrollment statistics, 2026 |
| Global Phase I–III trial starts (2024) | 10,503 (+5.5% YoY vs. 9,959 in 2023) | Citeline, 2025 |
| Industry-sponsored trial completions (2024) | 4,903 (+14.2% YoY) | Citeline, 2025 |
| Trials failing to meet original enrollment timeline | ~80% | 2020 review of enrollment barriers, cited in DataAlly, 2026 |
| Trials failing to complete due to insufficient enrollment | ~50% | Tufts CSDD / Medable financial modeling report |
| Screen failure rate, industry average (2019) | 36.3% (up from 34.7% in 2012) | Tufts CSDD, cited in Applied Clinical Trials |
| Patient dropout rate among enrolled patients | 30% | Tufts CSDD / Medable financial modeling report |
| Investigative sites that under-enroll or enroll zero patients | 48% of ~16,000 sites analyzed | Tufts CSDD, cited in DataAlly, 2026 |
| Share of U.S. population that has ever participated in clinical research | <5% | Tufts CSDD / Medable financial modeling report |
Table 3: The table highlights cumulative registered studies and interventional trials specifically registered up to 2025, which were reported to be more than 530,000 and 404,637, respectively. Global Phase I–III trials initiating in 2024 were valued at 10,503, which indicated a rise from 9,959 in 2023. Industry-sponsored trial completions in 2024 were reported to be 4,903, contributing to a rise of 14.2% YoY. Trials failing to meet the original enrollment timeline and completing due to insufficient enrollment contributed to approximately 80% and 50%, respectively. Screen failure rate by industry average in 2019 showed a rise from 34.7% in 2012 to 36.3% in 2019. The patient dropout rate among enrolled patients held at 30%, while investigative sites that under-enroll or enroll zero patients contributed to 48% of roughly 16,000 sites. Furthermore, the share of the U.S. population that has ever participated in clinical research was reported to be less than 5%.
This section encompasses Pricing, Cost Structure and Economics Analysis, Demand-Supply Analysis, Value Chain and Operating Models, Technology and Innovations, Regulatory and Policy Landscape, M&A, Partnerships, Deals and Investments, and Customer and Buyer Analysis.
|
Metric
|
Value
|
Source
|
|
Mean direct trial cost per day, Phase I
|
$7,829
|
Tufts CSDD, 2024
|
|
Mean direct trial cost per day, Phase II
|
$23,737
|
Tufts CSDD, 2024
|
|
Mean direct trial cost per day, Phase III
|
$55,716
|
Tufts CSDD, 2024
|
|
Mean direct trial cost per day, Phase IV
|
$14,091
|
Tufts CSDD, 2024
|
|
Estimated lost sales per day of trial delay
|
$800,000
|
Tufts CSDD, cited in AutoCruitment, 2026
|
|
Total capitalized cost per newly approved compound
|
$2.6 billion
|
Tufts CSDD estimate, cited in Clinical Leader, 2025
|
Table 4: The table highlights the cost and lost sales of clinical trials. Mean direct trial cost per day, Phase I, Phase II, Phase III, and Phase IV, was noted to be $7,829, $23,737, $55,716, and $14,091, respectively, which indicated that Phase III contributed to the highest cost. The estimated lost sales per day of trial delay was reported to be $800,000, while total capitalized cost per newly approved compound accounted for $2.6 billion.
| Metric | Value | Source |
| Investigative sites analyzed that under-enroll or fail to enroll | 48% of ~16,000 sites | Tufts CSDD, cited in DataAlly, 2026 |
| Ready-to-recruit sites that enroll zero patients | 1 in 10 | Tufts CSDD, cited in DataAlly, 2026 |
| U.S. adults willing to participate in clinical research | ~85% | Tufts/Medable DCT financial modeling report |
| U.S. adults living more than 2 hours from a study site | >70% | Tufts/Medable DCT financial modeling report |
| Actual U.S. population participation rate | <5% | Tufts/Medable DCT financial modeling report |
Table 5: The table covers the clinical sites and the patient participation rates. 48% of approximately 16,000 investigative sites analyzed under-enroll or fail to enroll, while ready-to-recruit sites that enroll zero patients accounted for 1 in 10 sites. An approximate 85% of U.S. adults were willing to participate in clinical research, where more than 70% of adults reported living more than 2 hours from a study site. Thus, the actual U.S. population participation rate contributed to less than 5%
The clinical trial value chain encompasses information from sponsor strategy and protocol design, which is covered through feasibility and site selection, site activation, patient recruitment, monitoring, data management, safety management, statistical analysis, study reporting, and regulatory submission, to post-market evidence generation. It also focuses on the cost profile across every stage, which differs, confirming that Phase III contributes the highest cost with the most extensive multi-site monitoring and data management infrastructure. The cost associated with Phase III contributes more than double that of Phase II and more than 7x Phase I cost, reflecting that the value-chain cost concentrates around mid-to-late trial-execution stages rather than in early design or late-stage reporting.
| Metric | Value | Source |
| FDA final guidance on decentralized trial elements | Published September 18, 2024 | FDA, 2024 |
| Guidance scope | Remote visits, monitoring, and local care options for trial participants | FDA, 2024 |
| DCT technology adoption reported time savings (site initiation through activation) | 80% of surveyed technology-investing sponsors | Tufts/Medable DCT financial modeling report |
Table 6: The given table indicates the FDA guidance and technology adoption advancements. September 18, 2024, the FDA issued final guidance on decentralized trial elements, where the guidance scope highlighted remote visits, monitoring, and local care options for trial participants. 80% of surveyed technology-investing sponsors contributed to DCT technology adoption.
The most significant recent regulatory development was the FDA's September 2024 final guidance on conducting clinical trials with decentralized elements, which focused on clinical trial management services delivery for remote monitoring, local labs, and telehealth visits as legitimate trial design components. The regulatory and policy landscape also covers FDA's broader Good Clinical Practice (GCP) and Investigational New Drug (IND) frameworks governing U.S. trials conducted for decades, as well as outlines HIPAA and electronic records/signature requirements under 21 CFR Part 11 essential for data management services.
Source: FDA, “FDA Publishes Final Guidance on Conducting Clinical Trials with Decentralized Elements,” Sept. 18, 2024.
| Deal | Year | Value | Source |
| LabCorp – Covance | 2015 | $6.0 billion | BioPharma Dive, 2021 |
| IMS Health – Quintiles merger | 2016 | $9.0 billion | BioPharma Dive, 2021 |
| ICON – PRA Health Sciences | 2021 | $12.0 billion | BioPharma Dive, 2021 |
| Thermo Fisher – PPD | 2021 | $17.4 billion | Pharmaphorum, 2023 |
| Syneos Health taken private | 2023 | $7.1 billion | Healthcare Dive, 2023 |
Table 7: The table illustrates strategic development from 2015 to 2023. In 2015, LabCorp was reported to secure $6.0 billion, while in 2016, $9.0 billion was achieved by IMS Health. ICON and Thermo Fisher in the year 2021 were noted to have held $12.0 billion and $17.4 billion, respectively. Additionally, Syneos Health in 2023 was reported to have secured $7.1 billion.
The verified buyer-side evidence indicates that trial economics and risk are responsible for driving outsourcing decisions. The Phase III trials cost $55,716/day, with delay estimated to cost $800,000 in lost sales for each day. This causes buyers such as large pharmaceutical sponsors conducting dozens of concurrent Phase III studies to utilize direct, quantifiable financial incentives to select CRO partners depending on their ability to protect enrollment timelines along with unit-cost pricing.
The section covers six segmentation dimensions such as Service, Trial Phase, Therapeutic Area, Sponsor Type, Execution Model, and End User along with their market-share and CAGR percentages.
| Segment | Verified Data Point | Source |
| By Service - Clinical Trial Monitoring | Phase III monitoring-intensive trials cost $55,716/day, making it the highest of any phase and concentrating monitoring service revenue in late-stage trials. | Tufts CSDD, 2024 |
| By Service - Patient Recruitment (“Other Services”) | The demand for these services is driven by increased trial failure rates due to a 36.3% average screen failure rate and approximately 50% enrollment | Tufts CSDD |
| By Trial Phase - Phase III | Phase III is identified as the largest service-revenue phase as it costs more than double Phase II per day ($55,716 vs. $23,737) | Tufts CSDD, 2024 |
| By Trial Phase - Phase IV | Post-marketing/real-world evidence trials cost $14,091/day, which makes them the second-lowest of the four phases. | Tufts CSDD, 2024 |
| By Sponsor Type - Large Pharmaceutical Companies | The single-sponsor service demand at scale was represented by Merck, which alone disclosed 80 concurrent Phase III studies (Jan. 2026) | PharmaLive, Jan. 2026 |
| By Execution Model - Full-Service Outsourcing | The rapid expansion of full-service capability was driven by 5 major CRO M&A deals from 2015-2023, which contributed to $51.5B | BioPharma Dive; Healthcare Dive |
| By End User - CROs (subcontracting) | The tiered CRO subcontracting structure within the end-user market was illustrated by a comparison between IQVIA's $15.4B revenue scale vs. Medpace's $2.1B | Company FY2024 filings |
By service type, the clinical trial monitoring segment held the major share of 29.50% of the market in 2025, due to increased outsourced site oversight to specialized providers, where the patient recruitment subsegment of other services held a significant share of 2.50% in 2025. By trial phase, phase III dominated the market with 48%, as large pivotal studies required extensive operational infrastructure, while the phase IV segment is expected to show the fastest growth with 9.40% CAGR. By sponsor type, the large pharmaceutical companies segment led the market with 42% market share, due to sustained trial volumes. By execution model, the full-service outsourcing segment registered dominance with 52% market share, due to a rise in demand for integrated trial execution, while by end user, the contract research organizations segment is anticipated to expand rapidly with a CAGR of 9.10%.
In January 2026, at the J.P. Morgan Healthcare Conference, Merck's CEO disclosed 80 concurrent Phase III studies, reflecting the scale of trial management services.
Source: PharmaLive, “2026 Pipelines to Watch,” Jan. 2026
In October 2025, based on Citeline's Annual Clinical Trials Roundup, it was confirmed that the global Phase I–III trial starts reached 10,503 in 2024, indicating a 5.5% increase over 2023, and it also highlighted a 14.2% increase in completed industry-sponsored trials to 4,903.
Source: Citeline, 2025
In August 2025, Citeline published an analysis highlighting that after the rapid regulatory reform initiated in 2015, clinical trial volume in China matched the U.S. in 2023, which contributed to the expansion of the global geography of clinical trial management service demand.
Source: Citeline (In Vivo), Aug. 2025
In April 2025, a confirmation regarding ClinicalTrials.gov at its 25th anniversary, that it had crossed 500,000 registered studies in 2024 and achieved over 530,000 by March 2025, was announced by the National Library of Medicine.
Source: NLM, “A 25-Year Journey to a Half-Million Registered Studies,” April 2025
On September 18, 2024, final guidance on conducting clinical trials with decentralized elements, formally recommending remote visits, telehealth, and local labs as legitimate trial design components, was published by FDA.
Source: FDA, 2024
On September 28, 2023, the successful completion of a $7.1 billion take-private transaction of Syneos Health was announced along with the association of Elliott Investment Management, Patient Square Capital, and Veritas Capital, which resulted in removing a top-3 CRO from public markets
Source: Syneos Health press release, Sept. 2023
In July 2023, Fortrea strengthened its position by becoming an independently traded, multi-billion-dollar full-service CRO with Phase I–IV capabilities after the completion of its spin-off from Labcorp
Source: Pharmaboardroom, “Top 10 CROs in 2024”
It is the world’s largest full-service CRO with $15.4 billion in FY2024 revenue.
It is the second-largest global full-service CRO, having acquired PRA Health Sciences for $12B in 2021 and holding approximately $8.7 billion in FY2024 revenue.
It is a full-service CRO with FY2023-FY2025 revenue of $2.7-$3.1 billion.
It is a full-service CRO that specializes in small-to-mid biotech sponsors and had $2.109 billion in FY2024 revenue.
It is an integrated biopharmaceutical solutions CRO that was taken private for $7.1B in 2023.
It is a diversified life sciences company that acquired PPD, a clinical research division, for $ 17.4 B in 2021.
It is a diagnostics and drug development services company that acquired Covance for $6B in 2015.
It is a large pharmaceutical sponsor that disclosed 80 concurrent Phase III studies, contributing to the largest publicly quantified sponsor loads.
It is the large pharmaceutical sponsor with 30 of 108 pipeline candidates in Phase III.
It is the data & intelligence provider and is the source of Trialtrove trial-start and completion data.
It is the academic research center that publishes authoritative cost-per-day, screen-failure, and enrollment benchmark data.
Aditi is a healthcare services research expert with strong experience in CRO consolidation and outsourced clinical development markets. She conducted detailed market research, analyzed company data, clinical trends, and industry developments. Based on her comprehensive analysis, the following strategic key takeaways highlight the most important market insights and opportunities.
For Service Providers & CDMOs
For Pharma & Biotech Sponsors
For Investors & Corporate Strategy Teams
Based on my assessment, the market is expanding rapidly due to growing clinical activities and pipeline candidates, which drive the demand for clinical trial management services. Growth in acquisitions and mergers is also increasing their demand. I also anticipate that the new collaboration and investments will also expand service capabilities. I also see strong growth in DCT technologies adoption, which will create new market opportunities.
Payal Rabde led the primary market research, developed the methodology, analyzed trends, segmentation, competition, forecasts, and strategic opportunities, forming the report's analytical foundation.
Aman was responsible for collecting and validating clinical trial data, research publications, company information, partnerships, and other quantitative datasets, strengthening evidence-based analysis and market estimations.
Aditi reviewed the complete research document, performed quality checks, validated findings, refined content, corrected inconsistencies, and finalized the report, ensuring accuracy, clarity, credibility, and publication-ready quality.
By Service
By Trial Phase
By Therapeutic Area
By Sponsor Type
By Execution Model
By End User
Speak with a healthcare analyst about your research, consulting, or platform needs.




 sales@towardshealthcare.com